Ridgeline Meteorological Sensor Network
This project focuses on creating a small-scale meteorological sensor network using scout towers and large MET towers for efficient wireless data transmission. Equipped with advanced communication technologies like Xbee-PRO for mesh networking, the system incorporates wind sensors, microcontrollers, and a dedicated coding framework for real-time data collection and processing. Comprehensive testing includes functionality, power consumption, security measures, and environmental durability, ensuring reliable performance in various weather conditions for effective climate monitoring.

Ridgeline Meteorological Sensor Network
E N D
Presentation Transcript
Ridgeline Meteorological Sensor Network Stephen Copeland, Xau Moua, Joseph Lane, Robert Akerson Client: Doug Taylor, John Deere Renewables Advisors: Dr. Manimaran Govindarasu, Dr.Venkataramana Ajjarapu
Project Plan • Small scout towers capable of wirelessly transmitting measurements to large MET towers. • Wireless communication via radio transceivers on scout tower and MET tower. • Built-in mesh networking protocol
Design Scope Signal Converter
Microcontroller and Wireless Shield Microcontroller Arduino Runs programmed code to send and receive data on mesh network Wireless Shield Xbee Provides easy form of adapter from transceiver to arduino due to header misalignment.
Transceiver and Antenna Transceiver Xbee-PRO digimesh 900 Provides mesh protocol Transmits data to other node Antenna 7" ½ wave dipole, bulkhead mount, RPSMA connector Omni-directional transmission of data
Wind Sensors Wind Vane NRG#200P Provides wind direction Angle from North=(360’/Vin)*Vout Vout ranging from 0 to Vin Anemometer NRG#40C Provides wind speed Generates a sine wave whose frequency determines wind speed
Sensor Circuitry Used to transform the Sine wave output from the Anemometer into a square wave which provides the arduino with a frequency that represents the measured wind speed.
Arduino Code Anemometer Output Signal • Scout Tower Code • Reads the Voltage Signal at selected pins of the Arduino • Aggregates data at a user specified interval Measures Pulse Width Converts Pulse Width to Wind Speed Sends Wind Speed to Serial Port
Arduino Code cont. • Central transceiver code • Receives data from all other nodes in the mesh network • Aggregates all of the data • Prints new data set to a text file Reads Signal From Transceivers Sends Data To Computer Averages Wind Speed Data
Testing • Sensor Testing • PCB Functionality Testing • Range Evaluations • Elevated testing locations north of Ames • Power consumption • Use of multi meters to measure current and voltage levels • Microcontroller • Basic data communication
Further Testing • Self Healing • Selected modules turned off during transmission • Security • Encryption of data being transmitted • Latency • Receiving rate vs. data size • Casing • Shock, vibration, realistic impact, and contact with water, ice, and snow.
Sensor Testing Anemometer Results • We connected the anemometer directly to an oscilloscope • Signal amplitude and frequency increases as wind speed increases
Sensor Testing Wind Vane Results • We connected the wind vane to 5V power supply • Oscilloscope gives output voltage over time • Voltage varies as wind vane changes direction from 0 to 360 degrees
PCB Functionality Testing and Anemometer Results • Able to obtain a sine wave from the anemometer • Outputs a square wave with a frequency relative to the actual wind speed
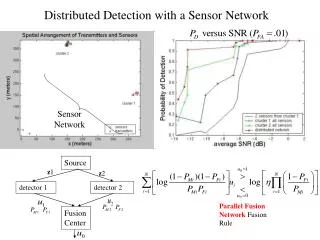
Aggregated Data Simulation • Wind speed in mph • Top node 1 • Middle node 2 • Both sampled and averaged every 10 seconds • Bottom average of node 1 and 2 calculated every 10 seconds
Microcontroller Results • Successful interfacing to the sensors and PCB for gathering of data • Aggregation of data from sensors • Storage of data as MPH in a text file from output
Antenna Results • Found optimal frequency of our antennas to be marker 1 • Freq= 896.247MHz marker 1 freq=896.2473 MHz dB(S(1,1))=13.97 marker 2 freq=1.8014 GHz dB(S(1,1))=13.66
Results for Rough Terrain Testing • We attached sensors to the roof of CooverHall. • Successful transmission of data to motors lab from two nodes on roof • Simulated rugged terrain at Veenker golf course north of campus • Achieved an approximate range of 0.8 Km between nodes.
Results for Range Testing • Tested North of Ames on a flat gravel road • Achieved an approximate range of 1.75Km
Power Consumption Results • We spliced the USB cable between the device and PC • Connected inner USB wiring to a multi meter • Through the use of P=I*V we determined the required power to be around 0.5 Watts
Self Healing Results Node 1 • Placement of four nodes at a certain distance preventing direct communication between first and last node • Upon the removal of a middle node from the system the line of communication is not broken Node 2 Node 3 Receiving Node User
Security and Latency Results • 128-bit encryption is incorporated in the protocol for the transceivers • Client required only verification of encryption setting in transceivers
Security and Latency Results • Node 1 sends current time to node 2 • Node 2 computes difference from it’s current time Time Synchronized Time Synchronized Node 2 Node 1
Case Testing Results • Remained water tight under running water • Absorbed force from hammer without damage to the inner components • Withstood 6℉ without damage
Mounting System • Consists of sections of PVC and Brass connectors to ensure stability for the sensors • Nema-4 enclosure • Clamped to vent pipes on the roof of Coover Hall
EE 491 Wind Turbine Project • Utilizes aggregated wind speed from the roof of Coover • USB interface with transceiver and Desktop PC • Uses Labview Software to run motor • Motor is coupled to a wind turbine which simulates wind power generation.
EE491 Wind Turbine Project cont. http://seniord.ece.iastate.edu/may1101
Recommendations • Use of renewable energy power source (wind or solar) • Integration of CFD into calculations for Wind Turbine project • Addition of more sensors to device • GPS units • Temperature Sensors • Barometers This would allow for better analysis of potential wind generation locations
Acknowledgements • Leland Harker, ISU Parts Shop • Senior Design Team SD MAY11-01 • Doug Taylor, John Deere • Brad Luhrs & Bryan Burkhardt , DMACC • Dr. Manimaran Govindarasu • Dr. Venkataramana Ajjarapu
Thank You Any Questions?