Download
1 / 2
20 likes | 113 Vues
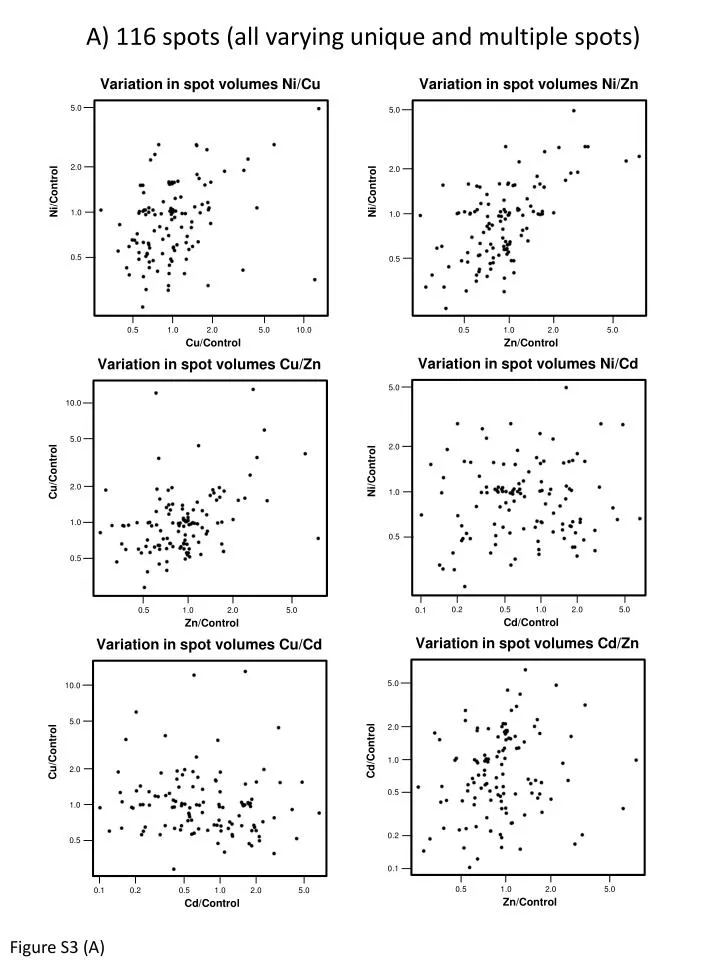
Explore and analyze varying unique spots with different metal combinations for Cu, Cd, Zn, and Ni. Investigate spot volume ratios and control set comparisons to understand material behavior. Detailed figure analysis provided in Figure S3.

E N D
A) 116 spots (all varying unique and multiple spots) Variation in spot volumes Cu/Cd Variation in spot volumes Cd/Zn Variation in spot volumes Cu/Zn Variation in spot volumes Ni/Cd Variation in spot volumes Ni/Cu Variation in spot volumes Ni/Zn 5.0 5.0 5.0 10.0 5.0 10.0 5.0 5.0 2.0 2.0 2.0 2.0 Cu/Control Cu/Control Cd/Control Ni/Control Ni/Control Ni/Control 1.0 2.0 2.0 1.0 1.0 1.0 0.5 1.0 1.0 0.5 0.5 0.5 0.2 0.5 0.5 0.1 0.1 0.5 0.2 0.2 0.5 0.5 0.5 1.0 0.5 0.5 1.0 1.0 1.0 2.0 1.0 1.0 2.0 2.0 2.0 2.0 2.0 5.0 5.0 5.0 5.0 10.0 5.0 5.0 0.1 Cu/Control Zn/Control Cd/Control Zn/Control Cd/Control Zn/Control Figure S3 (A)
B) 55 spots (all varying unique spots) Variation in spot volumes Cu/Cd Variation in spot volumes Cu/Zn Variation in spot volumes Cd/Zn Variation in spot volumes Ni/Cu Variation in spot volumes Ni/Cd Variation in spot volumes Ni/Zn 5.0 10.0 10.0 2.0 2.0 2.0 2.0 5.0 5.0 Cd/Control Cu/Control Cu/Control Ni/Control Ni/Control Ni/Control 1.0 1.0 1.0 1.0 2.0 2.0 0.5 1.0 1.0 0.5 0.5 0.5 0.2 0.5 0.5 0.1 0.1 0.5 0.2 0.2 0.5 0.5 0.5 1.0 0.5 1.0 0.5 1.0 1.0 2.0 1.0 1.0 2.0 2.0 2.0 5.0 2.0 2.0 5.0 5.0 5.0 10.0 5.0 5.0 0.1 Cu/Control Zn/Control Cd/Control Zn/Control Cd/Control Zn/Control Figure S3 (B)