Download

1 / 59
590 likes | 717 Vues
Overview of the Pacific Northwest Environmental Prediction System. Supported by the Northwest Modeling Consortium…the regional modeling effort centered at the UW is. Running the MM5 at 36, 12, and 4 km resolution Running the new WRF model at 36, 12 km and 4 km resolution

E N D
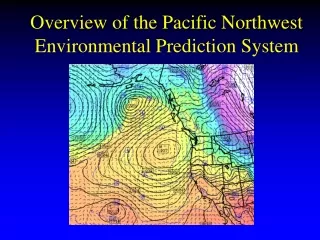
Overview of the Pacific Northwest Environmental Prediction System
Supported by the Northwest Modeling Consortium…the regional modeling effort centered at the UW is • Running the MM5 at 36, 12, and 4 km resolution • Running the new WRF model at 36, 12 km and 4 km resolution • Running TWO high resolution regional ensemble systems to provide probabilistic forecasts and data assimilation • Gathering all local weather observations from dozens of networks. Plus quality control. • Running a wide range of weather applications dealing with air quality, hydrology, transportation weather and fire weather.
NWNet: Regional Real-Time Collection of Over 60 Networks Over the Pacific Northwest
The UW Quality Control System • A major task continues to be the gathering of all real-time observations of the region into one place • Right now we acquire over 60 networks in real time for displaying on our web site, verification, and many other uses • Quality Control is essential for such a heterogeneous network of networks.
The UW Quality Control and Warning System • We have developed an advanced QC system suitable for an area of complex terrain Have also created an automated QC display system that one can check on the web and which can automatically tell the manager of a network when their data is suspect
The effort has roughly three clusters of Linux machines and 120 TB of storage
The UW Ensemble System • The UW ensemble system was borne out of experience from the high-resolution local MM5 effort (36-12-4 km resolution) • Specifically, although high resolution in general produced better (sharper, high amplitude) structures, the forecasts verified only marginally better than lower resolution forecasts using traditional measures. • UW research on forecast verification and evaluation revealed large differences, and thus uncertainty, in the initializations and forecasts of major operational forecasting systems. • Also apparent that there is considerable uncertainty in the model physical parameterizations.
UW Ensemble System • Previous results showed that approximately 12-km resolution was needed to get the major regional mesoscale features “right.” • Thus, it was natural to create a 12-km mesoscale ensemble system for the Northwest.
a) b) Configurations of the MM5 short-range ensemble grid domains. (a) Outer 151127 domain with 36-km horizontal grid spacing. (b) Inner 103100 domain with 12-km horizontal grid spacing. UW Mesoscale Ensemble System • Single limited-area mesoscale modeling system (MM5) • 2-day (48-hr) forecasts at 0000 UTC in real-time since January 2000. New 12 UTC cycle • 36 and 12-km domains. 12-km 36-km
UW Ensemble System • UW system is based on the use of analyses and forecasts of major operational modeling centers. • The idea is that differences in initial conditions of various operational centers is a measure of IC uncertainty. • These IC differences reflect different data inventories, assimilation schemes, and model physics/numerics and can be quite large, often much greater than observation errors. • In this approach each ensemble member uses different boundary conditions--thus finessing the problem of the BC restraining ensemble spread.
“Native” Models/Analyses Available Resolution (~@ 45 N ) Objective Abbreviation/Model/Source Type ComputationalDistributed Analysis avn, Global Forecast System (GFS), Spectral T254 / L64 1.0 / L14 SSI National Centers for Environmental Prediction ~55km ~80km 3D Var cmcg, Global Environmental Multi-scale (GEM), Finite 0.90.9/L28 1.25 / L11 3D Var Canadian Meteorological Centre Diff ~70km ~100km eta, limited-area mesoscale model, Finite 32km / L45 90km / L37 SSI National Centers for Environmental Prediction Diff. 3D Var gasp, Global AnalysiS and Prediction model, Spectral T239 / L29 1.0 / L11 3D Var Australian Bureau of Meteorology ~60km ~80km jma, Global Spectral Model (GSM), Spectral T106 / L21 1.25 / L13OI Japan Meteorological Agency ~135km ~100km ngps, Navy Operational Global Atmos. Pred. System, Spectral T239 / L30 1.0 / L14 OI Fleet Numerical Meteorological & Oceanographic Cntr. ~60km ~80km tcwb, Global Forecast System, Spectral T79 / L18 1.0 / L11 OI Taiwan Central Weather Bureau ~180km ~80km ukmo, Unified Model, Finite 5/65/9/L30 same / L12 3D Var United Kingdom Meteorological Office Diff. ~60km
Relating Forecast Skill and Model Spread Mean Absolute Error of Wind Direction is Far Less When Spread is EXTREME (Low or High)
Local Data Assimilation using an EnKF System • The system produces 90 different analyses that can be combined to produce the best guess at what is there and tell us the uncertainty in the analyses. • These analyses can be integrated forward in time to give us probabilistic predictions of the future • We now have it running at 36 and 12 km resolution…
A Vision of an Integrated Regional Prediction System Output from the UW MM5 is now being fed into a number of modeling and diagnostic systems: • Distributed Hydrological Model for Western Washington • Calgrid Air Quality Model • Land Surface Model for Surface Temperature Prediction • Smoke, Ventilation, and Fire Guidance • Transportation Information System
DHSVM: Distributed Hydrology Soil Vegetation Model • Terrain - 150 meter aggregated from 30 meter resolution DEM • Land Cover - 19 classes aggregated from over 200 GAP classes • Soils - 3 layers aggregated from 13 layers (31 different classes); variable soil depth from 1-3 meters • Stream Network - based on 0.25 km2 source area
11/25 12/01 12/07 12/13 12/19 December 11-12, 2001 Santium River
The UW/Washington State University Coupled MM5-Air Quality Prediction System
AIRPACT Regional Air Quality Modeling System IC/BC emissions chem mech dry dep p IC/BC landuse terrain landuse terrain MM5 CALMET CALGRID u, v formatted for each layer of CALMET 3D met field: u, v, w, T, BL variables 3D species field: O3, VOC, NOx, primary PM
AIRPACT Current Developments • Expand domain • Add air toxics • Improve PM emissions inventory • woodstoves & other primary PM sources • Improve web graphics and GIS content • Long term: convert to CMAQ
Road Weather Information System • This effort is a partnership between the UW and the Washington State Department in Transportation, with funding from the US Department of Transportation. • An attempt to combine weather data, modeling, road information, and other data sources into applications that can serve the public and the Washington State DOT. • Rick Steed will provide a detailed briefing.
Ventilation Index
U.S. Forest Service • MM5 grids are sent to the field for running Eulerian and Lagrangian smoke plume/dispersion models. • MM5 output used for fire fighting operations.
BlueSky Simulating Wildland Fire in Real-Time (www.fs.fed.us/bluesky)Susan O’Neill, Sue FergusonUSDA Forest ServiceRob WilsonUS EPA