Cost Analysis and Estimation
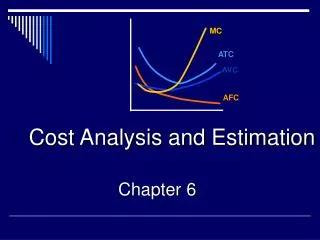
10E. Cost Analysis and Estimation. M ANAGERIAL E CONOMICS. M A R K H I R S C H E Y. Chapter 8. PowerPoint Presentation by Charlie Cook. © 2003 South-Western/Thomson Learning. Short-Run Cost Curves. Figure 8.1.

Cost Analysis and Estimation
E N D
Presentation Transcript
10E Cost Analysis and Estimation MANAGERIALECONOMICS M A R KH I R S C H E Y Chapter 8 PowerPointPresentation by Charlie Cook © 2003 South-Western/Thomson Learning
Short-Run Cost Curves Figure 8.1 Managerial Economics 10e
Total Cost Function for a Production System Exhibiting Increasing, Then Decreasing, Returns to Scale Figure 8.2 Managerial Economics 10e
Short-Run Cost Curves for Four Scales of Plant Figure 8.3 Managerial Economics 10e
Long-Run Average Cost Curve as the Envelope of Short-Run Average Cost Curves Figure 8.4 Managerial Economics 10e
Effect of Transportation Costs on Optimal Plant Size Figure 8.5 Managerial Economics 10e
Three Possible Long-Run Average Cost Curves for a Multiplant Firm Figure 8.6 Managerial Economics 10e
Plainfield Electronics: Single Versus Multiplant Operation Figure 8.7 Managerial Economics 10e
Probability Distributions of Demand Figure 8.8 Managerial Economics 10e
Alternative Plants for Production of Expected 5,000 Units of Output Figure 8.9 Managerial Economics 10e
Long-Run Average Cost Curve Effects of Learning Figure 8.10 Managerial Economics 10e
Learning Curve on an Arithmetic Scale Figure 8.11 Managerial Economics 10e
Linear Cost-Volume-Profit Chart Figure 8.12 Managerial Economics 10e
Breakeven and Operating Leverage (Firm A) Figure 8.13a Managerial Economics 10e
Breakeven and Operating Leverage (Firm B) Figure 8.13b Managerial Economics 10e
Breakeven and Operating Leverage (Firm C) Figure 8.13c Managerial Economics 10e
Cost and Production Functions Figure P8.1 Managerial Economics 10e