Changes in State
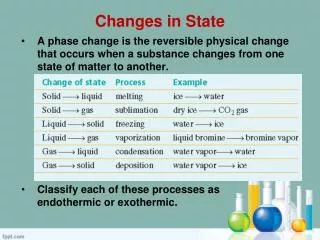
Changes in State. Vapor Pressure observation definition temperature dependence Changes in State enthalpies heating curves Phase Diagrams special points examples. Vapor Pressure. Dfns. pres. of vapor present above a (l) or (s)

Changes in State
E N D
Presentation Transcript
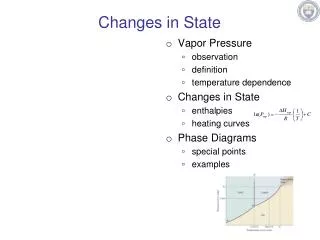
Changes in State • Vapor Pressure • observation • definition • temperature dependence • Changes in State • enthalpies • heating curves • Phase Diagrams • special points • examples
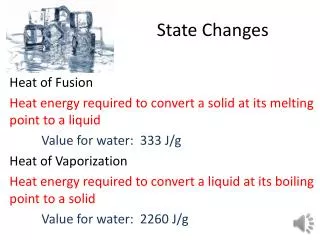
Vapor Pressure • Dfns. • pres. of vapor present above a (l) or (s) • DHvap energy to convert 1 mole liquid to gas at 1 atm • Eq. Vapor Pressure • rate of evaporation = rate of condensation • Measuring Pvapor • Hg column Pvapor = Patm – PHg column
Temperature Dependence R = 8.3145 J/mol•K T = temperature (K) C = const. related to DS
Changes in State: Heating Curve condensation evaporation
Changes in State: Heating Curve condensation evaporation freezing melting
Changes in State: Heating Curve condensation evaporation enthalpy of vaporization freezing melting
Changes in State: Heating Curve condensation evaporation enthalpy of fusion enthalpy of vaporization freezing melting
Phase Diagrams Iodine • Represents the phases of a material at various T and P in a closed system • Experiments • 1: T at P = 1 atm 1 (0.118 atm) (546 C) http://cwx.prenhall.com/petrucci/medialib/ media_portfolio/text_images/FG13_18.JPG
Phase Diagrams Iodine • Represents the phases of a material at various T and P in a closed system • Experiments • 1: T at P = 1 atm • 2: T at P = 0.01 atm 1 (0.118 atm) 2 (546 C) http://cwx.prenhall.com/petrucci/medialib/ media_portfolio/text_images/FG13_18.JPG
Phase Diagrams Iodine • Represents the phases of a material at various T and P in a closed system • Experiments • 1: T at P = 1 atm • 2: T at P = 0.01 atm • 3: T at P = 0.118 atm 1 3 (0.118 atm) 2 (546 C) http://cwx.prenhall.com/petrucci/medialib/ media_portfolio/text_images/FG13_18.JPG
Phase Diagrams Iodine • Represents the phases of a material at various T and P in a closed system • Experiments • 1: T at P = 1 atm • 2: T at P = 0.01 atm • 3: T at P = 0.118 atm • 4: T at P = 1 atm 4 1 3 (0.118 atm) 2 (546 C) http://cwx.prenhall.com/petrucci/medialib/ media_portfolio/text_images/FG13_18.JPG
Phase Diagrams Iodine • Represents the phases of a material at various T and P in a closed system • Experiments • 1: T at P = 1 atm • 2: T at P = 0.01 atm • 3: T at P = 0.118 atm • 4: T at P = 1 atm • 5: P at T = 100. C 4 1 3 (0.118 atm) 2 5 (546 C) http://cwx.prenhall.com/petrucci/medialib/ media_portfolio/text_images/FG13_18.JPG
Phase Diagrams Iodine • Represents the phases of a material at various T and P in a closed system • Experiments • 1: T at P = 1 atm • 2: T at P = 0.01 atm • 3: T at P = 0.118 atm • 4: T at P = 1 atm • 5: P at T = 100. C • 6: P at T = 150. C 4 1 3 (0.118 atm) 2 5 6 (546 C) http://cwx.prenhall.com/petrucci/medialib/ media_portfolio/text_images/FG13_18.JPG