Maximizing Data Precision and Presentation in Scientific Research
Learn how to record RAW data accurately with neat data tables, uncertainty measurements, and consistent precision. Process the data by averaging trials and creating graphs with best fit lines for clear visualization. Lastly, present processed data effectively with error bars indicating uncertainty.

Maximizing Data Precision and Presentation in Scientific Research
E N D
Presentation Transcript
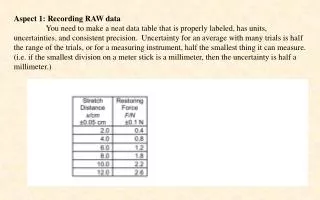
Aspect 1: Recording RAW data You need to make a neat data table that is properly labeled, has units, uncertainties, and consistent precision. Uncertainty for an average with many trials is half the range of the trials, or for a measuring instrument, half the smallest thing it can measure. (i.e. if the smallest division on a meter stick is a millimeter, then the uncertainty is half a millimeter.)
Aspect 2: Processing RAW data Average multiple trials. Make a graph with a best fit line if appropriate. The x axis should be the independent (manipulated) variable, and the y axis should be the dependent (measured) variable. Put a best fit line with a calculated slope through the points only if it seems to suggest a line. Title your graph, and label your axes with units. Aspect 3: Presenting processed data If the uncertainty is too small for error bars, indicate this, otherwise include error bars. Use the first and last points’ error bars (unless one is an obvious outlier) to determine the minimum and maximum slope. Calculate the result from the slope (if you need to) and express it as a best guess plus or minus an uncertainty. The uncertainty is (high-low)/2 of the values you determine from the min and max slope.