Effective Raw Data Recording for Science Lab Experiments
290 likes | 407 Vues
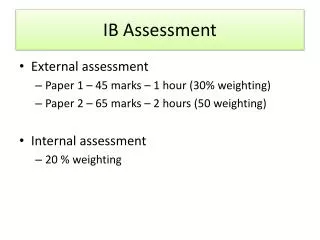
Learn the importance of raw data recording in science labs, including table formatting, equipment uncertainty, and observations. Key aspects covered: title, labeling, units, observations, equipment uncertainty, and precision.

Effective Raw Data Recording for Science Lab Experiments
E N D
Presentation Transcript
DCP- Aspect 1: Recording raw dataWhat is “raw” data? • Quantitative & Qualitative data that you directly collect during the lab (BEFORE any math is done) • Mass • Volume • Temperature • Observations (qualitative)
What needs to be included in DCP- Aspect 1: Recording raw data? • Title of Data Table • Columns & rows completely labeled • Observations • Level of equipment uncertainty • Level of precision in recorded data remains constant (same number of decimal places)
Title of Data Table; must be… • Numbered • Table 1: ------- • Descriptive: includes both DV & IDV as well as detail • Table 1: Initial & Final Mass of a Dialysis Tube Containing Five Different Concentrations of Sucrose Solution When Immersed for 20 Minutes
Columns & rows completely labeled; must have… • Complete label for column (or row) • Correct Concentration of Sucrose Solution • Incorrect Concentration • Incorrect Concentration of Solution • Incorrect Solution Concentration • Units!! • (M) for Molarity • Always use metric system (no “pounds” or “inches”) • If Data table goes onto a 2nd page, you mustinclude complete column headings again
NOTICE!! The units are ONLY at the top next to the label. Units do NOT go next to the data (#) being recorded.
Page 1 Page 2
Observations; must have… • Detail • If recording data over time (ex: each day for a week), then you will have specific observations every day • Important for your conclusion! (sources of error) • If you state it in conclusion, must be in observations • Description • Be specific as to what you see but do not draw conclusions here
Example 1 Example 2
Equipment uncertainity • IB Bio is different for error than IB Chemistry (yea!) • IB Bio only requires that you look at the equipment you are using when collecting data; list the uncertainty for that equipment only (degree of precision is ± the smallest division on the instrument) • Ex for a scale: if the scale measures to the hundredths place, the equip. uncertainty is +/- 0.01g (can be found on bottom of scale) • 0.005g error for scale + 0.005g error when massing an object = .01g • Ex for ruler: If measuring in centimeters +/- 0.1cm • Do NOT list for anything the teacher provides (example- if I make a solution for you, do not include uncertainty of graduated cylinder) • List that information in 1 place near your raw data table
+/- 0.1g • 0.05g error for scale + 0.05g error when • massing an object = .1g 56 mL +/- 0.5mL +/- 0.01g
Table 1: Height of Wisconsin Fast Plant When Exposed to Blue Wavelengths of Light over 7 Days #’d and descriptive Title Complete column label with units Observations- detailed Uncertainty of ruler measurement: +/- 0.1cm Uncertainty (here or in column heading)
Table 1: Trial #1- Height of Wisconsin Fast Plants When Exposed to Five Different Light Wavelengths over 7 Days NOTE: how to label data when have 2 titles for a column (height & color) NOTE: data is all showing same # of decimal places (“1.0” not “1”) NOTE: observations for all colors each day
Practice scoring this table: • Mini-checklist: • Title of Data Table • Columns & rows completely labeled • Observations • Level of equipment uncertainty • Level of precision
DESIGN- Aspect 2 Processing raw dataWhat is “processed” data? • This is the final data that you will use in order to answer your original research question. • If your question is looking to compare a rate, such as a growth rate: • Raw data: height (cm) for each unit of time(day) • Processed data amount of growth in cm per day (cm/day) • You will use math (or a computer will use math) in order to convert your raw data into processed data. • An average is NOT considered enough to be counted as data processing (even though you will need to average trials before continuing into “processing”)
In order to process your data: • You need to consider what data you have & what you want the data to look like in order to answer your question. • If you are doing the math, you must show 1 example of each type of calculation (this will be counted towards Asp 3 “presentation”). • Should come between raw data and your presentation of your processed data (table showing what you calculated) • Also, in order to earn a “complete” for Aspect 2 in DCP, you must use all of your data points while processing.
Which processing is the weakest? • Background Raw data includes height of plant every school day totaling 10 data points over 12 days (plant still grows over the weekend) • trying to calculate rate of growth (cm/day) • (final height – initial height) /12 days • Graph raw data & take slope of the line • Calculate rate of growth between each recorded data point & then calculate the average Height of Fast plant (cm) Time (days) Score for Aspect 2 would be a “1”
Examples of scoring: • Background Raw data includes height of plant every school day totaling 10 data points over 12 days (plant still grows over the weekend) Took weekends into account; Slope (growth rate)= 0.16cm/day Didn’t take weekends into account; Slope (growth rate)= 0.21cm/day SCORE: 0 major mistake!
Presentation= Table & Graph • When presenting your processed data in a table, it can be a new table or an extra column in an existing table. • Just like all tables, it needs to have a complete title, column headings, degree of precision, etc. • Also need to take into account SIG FIGS • Don’t show your processed data to be more precise than the equipment you used to collect the data • FYI: If your lab dealt with counting living organisms, then IB expects you to round to the nearest whole organism at the end in processing & then present that number. Show BOTH unrounded & rounded! • Sometimes the rounding of living organisms makes it look like there wasn’t a difference (ex: 1.4 #/day vs. 0.6 #/day both round to 1 #/day)
Graphs are also numbered & have the same title as your table • Be sure you have the right type of graph • When labeling bar graphs (Excel calls them “column” graphs), take note of how to label the x-axis: Complete label & unit below; ONLY numbers on x-axis line
ºC should not be part of axis; it should only be underneath next to “temperature” FYI: This person also included equipment uncertainty here, but it isn’t necessary.
Asp 1- Scoring Practice: Why is this a “1/ partial?” Where are the observations?? Should have table #! Temp listed under “maggot #”
Asp 2- Scoring Practice: Why is this a “2?” What if this student had only calculated an average? An average is NOT sufficient math to be considered processing! Therefore, there isn’t any processing.
Asp 3- Scoring Practice: Why is this a “1/ partial?” Units go at the top of the column only! Missing the example/sample calculation. Processed data should ALSO be in a table! Units do not go on x-axis! They go with the label