Download
1 / 11
110 likes | 239 Vues
Enzyme Internal Assessment Lab Report Guidelines. General Guidelines. Use Experimental Design Map to guide lab report writing Include introduction paragraph which outlines the following: Purpose or stated research question Proposed hypothesis which clearly identifies IV and DV

E N D
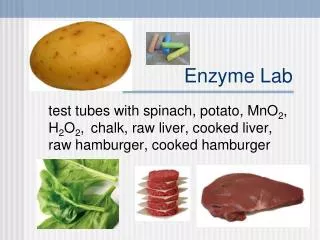
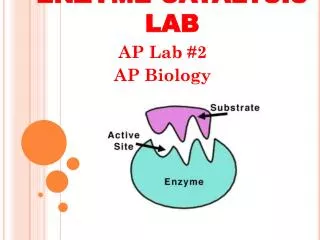
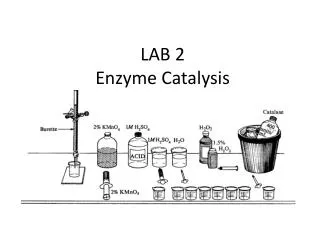
General Guidelines • Use Experimental Design Map to guide lab report writing • Include introduction paragraph which outlines the following: • Purpose or stated research question • Proposed hypothesis which clearly identifies IV and DV • List materials used to perform experiment • List procedural steps used to perform experiment • Photos, drawings or illustrations of experimental set up are acceptable but NOT required. NO Hand-drawings unless they are flawless; be certain to label drawings or illustrations • Provide safety precautions used to perform experiment
General Guidelines Continued • Use the following format on the first page, and your last name and page number on subsequent pages First and last names Enzyme IA Mills IB Biology HL1 Page number • You must cite resources from which you obtained research information for testing your enzyme and substrate • Include a separate page for citations and use APA format • Refer to IB Internal Assessment Criteria to guide data collection and processing and conclusion and evaluation statements
Data Tables • Provide titles for all data tables • Titles should reflect what the experiment tested • Typical two-column tables show independent variable (IV) on left side (1st column) and dependent variable (DV) on right side (2nd column) • Provide appropriate labels for IV and DV • Include units of measurement when applicable • Refer to Boot Camp Reference GuideDrawing Tables
Data Tables Cont’d • Examples shown are two of many ways you can create your data tables • Tables should reflect any degrees of uncertainty associated with equipment used for measuring and collecting data • The measured value and its uncertainty must always have the same number of digits after the decimal place (from http://physicsed.buffalostate.edu/pubs/MeasurementAnalysis/MA1_9ed.pdf) • Refer to Boot Camp Reference GuideError Analysis in Biology • When determining an uncertainty from a measuring device, you need to first determine the smallest quantity that can be resolved on the device; the uncertainty in the measurement is taken to be this value • (from http://physicsed.buffalostate.edu/pubs/MeasurementAnalysis/MA1_9ed.pdf)
Data Tables Final Info –YEA! • Notation for measurements and their uncertainties takes the following form: (measured value +uncertainty) proper units, where the +is read `plus or minus‘ (from http://physicsed.buffalostate.edu/pubs/MeasurementAnalysis/MA1_9ed.pdf) • Include degree of uncertainty in data table where applicable
Example 3: Table with Uncertainty The results of an investigation on the effect of light on the cyclosis of chloroplasts
Graphs: Data Processing and Presentation • Use data tables to present data • Include graph titles for all data tables • Titles should reflect what the experiment tested • Determine which type of graph will best present data, i.e., bar, scatter, pie • Provide appropriate labels for IV and DV and place them on the appropriate axes when applicable • Include units of measurement when applicable • The following link provides some guidelines for selecting appropriate graphs • Selecting Graphs
CE: Conclusion and Evaluation • Summarize overall research question and procedure State a conclusion and justify it with an interpretation of the data • Was your hypothesis supported by the data? • Why or why not? • Evaluate weaknesses and limitations • Provide realistic improvements you could implement based upon identified weaknesses and limitations, if you repeated the experiment.