Download
1 / 15
150 likes | 169 Vues
Read about Neuse & Tar-Pam Agricultural Rules and Progress Reports focusing on N and Phosphorus reduction goals, Basin Oversight & Advisory Committees, annual NLEW tool usage, P-loss indicators, and future steps for BMP implementation.

E N D
Annual Agriculture Progress Reports Neuse & Tar-Pamlico River Basins November 2012 Prepared by the Neuse and Tar-Pamlico Basin Oversight Committees John Huisman Division of Water Quality
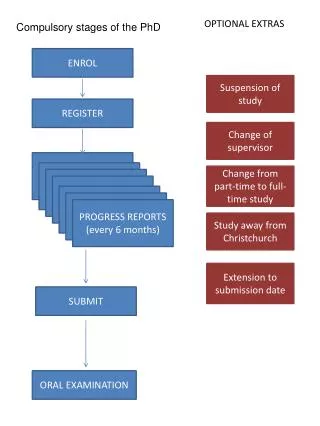
Rule OverviewNeuse & Tar-Pam Agricultural Rules • Effective: • August 1998 (Neuse) and September 2001 (Tar-Pam) • Goal: • 30% N reduction in N load from baseline • Tar-Pam: No increase in Phosphorus load • Collective Implementation • 2 Basin Oversight Committees (BOCs) • 31 Local Advisory Committees (LACs) • Annual Reports – Use NLEW accounting tool
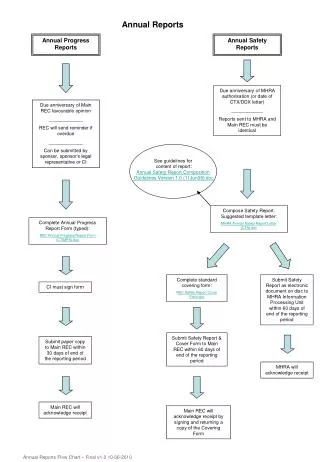
Phosphorus Loss TrackingTar-Pamlico River Basin • Tar-Pam Ag Rule: • No increase in P from baseline year • Development of a Phosphorous Loss Accounting Method • Approved a P accounting method in 2005 • Nine (9) Indicators are used to qualitatively assess the risk of P loss • Indicators characterize changes in land use and management to assess P-loss risk compared against the baseline year (1991) • 2011 BOC findings - No net increase in P loss risk
Future Steps • Encourage BMP implementation • Targeted outreach for: • Falls Lake NSW Strategy • Technician & LAC meetings will be held Winter-Spring 2013
Acknowledgements Neuse & Tar-Pamlico Technicians Producers LACs BOCs Local SWCD DSWC NRCS CES NCDA & CS NASS NLEW Committee NCSU DWQ
Questions Neuse Basin John Huisman DWQ – Nonpoint Source Planning Unit Phone: (919) 807-6436 Email: John.Huisman@ncdenr.gov Tar-Pamlico Basin Mike Herrmann DWQ – Nonpoint Source Planning Unit Phone: (919) 807-6497 Email: Michael.Herrmann@ncdenr.gov
Nitrogen Loss Estimation Worksheet (NLEW) • Empirical Spreadsheet-based Model • Developed by DWQ, NRCS, and NCSU • Update in 2011: Decrease buffer N removal efficiency • Estimates Nitrogen Loss from Cropland Ag • Compare baseline loss to current crop year • Loss Estimates at County Scale • Technicians Collect Data Annually • Number of Acres / Type of Crop • Fertilization Rates • BMPs implemented
Phosphorus Loss TrackingTar-Pamlico River Basin 2011 P-Loss Indicators * Reported conservation tillage (CT) reflects active cost share contract acres, not acres where contracts have expired but continue to use CT.
How were the N Loss reductions achieved? Tar-Pamlico River Basin