1 / 0

2.2 More Graphs and Displays

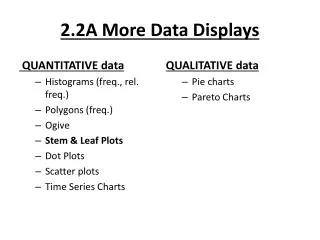
2.2 More Graphs and Displays. Stem-and-leaf plots and dot plots Pie charts and Pareto charts Scatter plots and time series charts. Try it yourself 1. Constructing a Stem and Leaf Plot

jake
Télécharger la présentation

2.2 More Graphs and Displays

An Image/Link below is provided (as is) to download presentation Download Policy: Content on the Website is provided to you AS IS for your information and personal use and may not be sold / licensed / shared on other websites without getting consent from its author. Content is provided to you AS IS for your information and personal use only. Download presentation by click this link. While downloading, if for some reason you are not able to download a presentation, the publisher may have deleted the file from their server. During download, if you can't get a presentation, the file might be deleted by the publisher.

E N D

Presentation Transcript


  1. 2.2 More Graphs and Displays

    Stem-and-leaf plots and dot plots Pie charts and Pareto charts Scatter plots and time series charts
  2. Try it yourself 1 Constructing a Stem and Leaf Plot Use a stem-and-leaf plot to organize the ages of the 50 richest people data set listed in the Chapter Opener on page 37. What can you conclude? 89 89 87 86 86 85 83 83 82 81 80 78 78 77 76 73 7373 72 69 69 68 67 66 66 65 65 64 63 61 61 60 59 58 57 56 54 54 53 53 51 51 49 47 46 44 43 42 36 35
  3. Try it yourself 1 3 6 5 4 9 7 6 4 3 2 5 9 8 7 6 4 4 3 3 1 1 6 9 9 8 7 6 6 5 5 4 3 1 1 0 7 8 8 7 6 3 33 2 8 9 9 7 6 6 5 3 3 2 1 0 3 5 6 4 2 3 4 6 7 5 1 1 3 3 4 4 6 7 8 9 6 0 1 1 3 4 5 5 6 6 7 8 9 9 7 2 3 33 6 7 8 8 8 0 1 2 3 3 5 6 6 7 9 9
  4. Try it yourself 2 Constructing Variations of Stem-and-Leaf Plots Using two rows for each stem, revise the stem-and-leaf plot you constructed in the previous example.
  5. Try it yourself 2 3 3 5 6 4 2 3 4 4 6 7 9 5 1 1 3 3 4 4 5 6 7 8 9 6 0 1 1 3 4 6 5 5 6 6 7 8 9 9 7 2 3 33 7 6 7 8 8 8 0 1 2 3 3 8 5 6 6 7 9 9
  6. Try it yourself 3 Constructing a Dot Plot Use a dot plot to organize the ages of the 50 richest people data set listed below. What can you conclude from the graph? 89 89 87 86 86 85 83 83 82 81 80 78 78 77 76 73 7373 72 69 69 68 67 66 66 65 65 64 63 61 61 60 59 58 57 56 54 54 53 53 51 51 49 47 46 44 43 42 36 35
  7. Try it yourself 3
  8. Try it yourself 4 Constructing a Pie Chart The numbers of earned degrees conferred (in thousands) in 1990 are shown in the table. Use a pie chart to organize the data. (Source: U.S. National Center for Educational Statistics)
  9. Try it yourself 4
  10. Try it yourself 5 Constructing a Pareto Chart Every year, the Better Business Bureau (BBB) receives complaints from customers. In a recent year, the BBB received the following complaints. 7792 complaints about home furnishing stores 5733 complaints about computer sales and service stores 14,668 complaints about auto dealers 9728 complaints about auto repair shops 4649 complaints about dry cleaning companies Use a Pareto chart to organize the data. What source is the greatest cause of complaints? (Source: Council of BBB’s)
  11. Try it yourself 5
  12. Try it yourself 6 Interpreting a Scatter Plot The lengths of employment and the salaries of 10 employees are listed in the table below. Graph the data using a scatter plot. What can you conclude?
  13. Try it yourself 6
  14. Try it yourself 7 Constructing a Time Series Chart Use the table to construct a time series chart for subscribers’ average local monthly cellular telephone bills for the years 1998 through 2008. What can you conclude?
  15. Try it yourself 7
More Related