2.2A More Data Displays
60 likes | 184 Vues
Explore the various data display techniques used in statistical analysis, including quantitative methods like histograms, dot plots, scatter plots, and time series charts, as well as qualitative methods such as pie charts and Pareto charts. We’ll delve into stem-and-leaf plots, offering insights on ordered and unordered variations, and emphasizing the importance of exploratory data analysis pioneered by John Tukey. Learn how to visualize data effectively to uncover patterns and insights that drive informed decision-making.

2.2A More Data Displays
E N D
Presentation Transcript
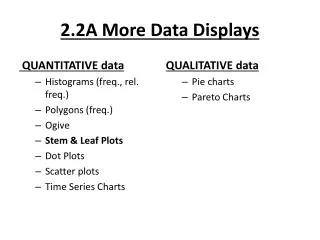
2.2A More Data Displays QUANTITATIVE data • Histograms (freq., rel. freq.) • Polygons (freq.) • Ogive • Stem & Leaf Plots • Dot Plots • Scatter plots • Time Series Charts QUALITATIVE data • Pie charts • Pareto Charts
Stem & Leaf Plots • EDA -Exploratory Data Analysis: John Tukey-77 • Similar to histogram • Still has original data values • Each number is separated • Stem=left most digit(s) • Leaf = right most digit: unordered OR ordered • Variation: 2 rows each stem (leaf 0-4 and 5-9)
Example: Unordered Stem & Leaf RBI’s for American League Leaders 7 8 Key: 15 5 = 155 8 Sample size = 9 10 5 8 9 9 9 Min= 11 6 4 2 2 8 8 9 3 7 8 9 9 2 Max= 12 9 6 2 6 2 1 6 2 6 3 1 4 4 9 6 13 0 9 9 3 4 2 3 14 4 5 2 0 5 8 7 15 5 9
Example: Ordered Stem & Leaf RBI’s for American League Leaders 7 8 Key: 15 5 = 155 8 Sample size = 9 10 5 8 9 9 9 min= 11 2 2 2 3 4 6 7 8 8 8 9 9 9 max= 12 1 1 2 2 2 3 4 4 6 6 6 6 6 9 9 13 0 2 3 3 4 9 9 14 0 2 4 5 5 7 8 15 5 9
Variation & Unordered 7 7 8 8 8 9 9 10 10 5 8 9 9 9 11 4 2 2 3 2 11 6 8 8 9 7 8 9 9 12 2 2 1 2 3 1 4 4 12 9 6 6 6 6 9 6 13 0 3 4 2 3 13 9 9 14 4 2 0 14 5 5 8 7 15 15 5 9
Stem & Leaf Variation -Ordered 7 7 8 8 8 9 9 10 10 5 8 9 9 9 11 2 2 2 3 4 11 6 7 8 8 8 9 9 9 12 1 1 2 2 2 3 4 4 12 6 6 6 6 6 9 9 13 0 2 3 3 4 13 9 9 14 0 2 4 14 5 5 7 8 15 15 5 9