Analyzing Relationships with Scatterplots and Lines of Best Fit
This educational resource explores the use of scatterplots and regression analysis to investigate relationships in data. It details how scatterplots visually represent data points, and how lines of best fit (LOBF) can reveal trends. The guide explains calculating the slope and y-intercept of the regression line, interpreting the Correlation Coefficient (r-value) to assess the fit of the line, and making predictions through interpolation and extrapolation. Activities are included to practice these concepts effectively.

Analyzing Relationships with Scatterplots and Lines of Best Fit
E N D
Presentation Transcript
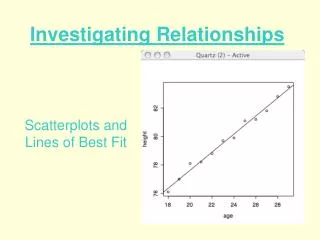
Investigating Relationships Scatterplots and Lines of Best Fit
collected analyzed Data is constantly ____________ and _________ to determine if there are ______________. One way this is done is through scatterplots and regressions. A _________ is a graph that consists of a set of points. relationships scatterplot
approximated Sometimes, the points in a scatterplot can be ______________ by a line (or a curve). This line or curve (called a ________) may help to see if there is a relationship. Regressions can also be referred to as a ________________, or a ____________. regression line of best fit (LOBF) curve of best fit
When drawing a line of best fit, the points on the scatterplot should show the trend of the data. Generally the points should be “________” on each side of the line. If a regression is a good fit, (points are close to the LOBF), we can make _________ by interpolating & extrapolating the data. (Reading the data off the graph) balanced predictions
equation If the regression is a good fit, find the _______ of the line (or curve.) To find the equation of the LOBF: • Calculate the ____ of the line from the graph (use any 2 points.) • Calculate the _________ the using the slope and the coordinates of one point. (If there are any breaks in the scale you must calculate the y-intercept) slope y-intercept
The Correlation Coefficient: Linear regression is a method of finding the equation of the ________________ The ________________ or _______ indicates how well the line fits the data. • If r= ___ then the line is a perfect fit. (all points are on the line) • If r= _ no linear relationship exists. (points are scattered randomly) line of best fit (LOBF) correlation coefficient r-value +1 0
Homework • Do the Activity • Pg. 337 # 1, 2 • Pg. 343 # 5