Optimizing Tracker Geometry Using Simulation at the LHC: Challenges & Solutions
E N D
Presentation Transcript
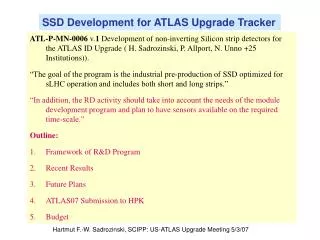
Upgrade Tracker Simulation Studies Richard Partridge – SLAC SLUO LHC Workshop
Simulation Can Help… Optimize Tracker Geometry • Identify number of layers needed for robust tracking • Locate transitions between pixels, short and long strips • Evaluate options for placement of tracking layers Optimize Stave / Module Design • Compare performance of design alternatives Optimize Placement of Services • Determine performance impact of dead material • Investigate alternatives for routing of services Quantify Detector Performance • Measure tracker and physics performance benchmarks
Simulation Challenges • Challenging environment for track finding • Expect >106 hits in tracker just from pileup interactions – need sufficient layers to beat down combinatoric fake track rate • Non-negligible dead material – multiple scattering and secondary interactions are important factors • Cost and material dictate small number of layers – cannot afford $ or material to grossly over-design • Detailed / realistic simulations essential • Pattern recognition is the key issue – tracker must be capable of efficiently finding real tracks with a low rate for fake tracks • Need to have confidence that simulations are accurately measuring tracker performance, not limits of simulation software • Flexibility to make comparative studies • Optimizing the tracker design requires the ability to compare design alternatives without extensive code changes
Simulation Tools • Athena / Geant 4 • Adapt existing ATLAS detector simulation to upgrade geometry • New layers overflow 32 bit identifier scheme 64 bit identifiers • Need to accommodate new endcap geometry • ATLSIM / Geant 3 • Used for early ATLAS simulations • Very detailed description of current detector • Some geometry changes easy, some are hard • LCSim / Geant 4 • Apply Linear Collider simulation tools to ATLAS upgrade • Compact geometry description geometry changes are easily made • Tools designed specifically for realistic detector optimization • Fatras (modest SLAC contribution) • Fast hit simulation from MC generated particles • Material description extracted from Athena / Geant 4
Why Have Multiple Tools? • Cross check / verification of results • Want to make sure we are measuring intrinsic detector performance, not the features / limitations of our tools • If we get consistent results from independent set of tools, we are probably measuring detector performance • Where results are different, we may also learn something useful about simulation assumptions and/or algorithm behavior • Different tools have different strengths • Athena/G4 builds on existing ATLAS tools • Many early simulation results produced with ATLSIM • LCSim has flexible and easily modified geometry description • Fatras provides fast simulations with standard ATLAS track finding • Some “friendly competition” is usually a good thing • Spurs innovation, challenges assumptions / prejudices Some VERY preliminary results follow
Pileup Interactions Moraes et al, EPJ C 50, 435 (2007) • Low pT pileup interactions dominate tracker occupancy • For L = 1035, ~400 interactions/xing at 50 ns spacing • 25 ns beam spacing and/or luminosity leveling would lower #int/xing • Higher luminosity, new contributions to the inelastic cross section would increase #int/xing • Number of charged particles per interaction (dN/dh) also has some uncertainty
Charged Particle Multiplicity at L = 1035 ATLAS Tune: dN/dh = 6.8 / Int Tevatron Tune: dN/dh = 5.6 / Int (5.3 if you remove diffractives) No pT Cut Diffractives: dN/dh = 0.3 / Int.
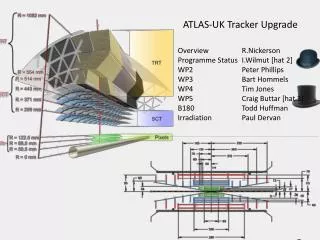
Tracker Occupancy • Even with silicon pixel and strip sensors, hit occupancy is not small • Use short (2.5 cm long) strips at intermediate radius to reduce occupancy Short Strips Long Strips Pixels
Secondary Interactions • Each tracker layer contributes 2-3% X0 of material • Origin of non-prompt charged particles shows substantial contribution from secondary interactions
Tracking Efficiency • Tracking efficiency is the fraction of tracks found by the track reconstruction code • Efficiency depends strongly on what is counted in the efficiency “denominator” • Given the high occupancies and small number of tracking layers, not all tracks will be findable with high efficiency and low fake rate • Focus on prompt tracks with pT >1 GeV, |h| < 2.5, and |d0| < 2 mm • Take efficiency to be the fraction of selected tracks that are found
Tracking Efficiency for Muons • Add randomly distributed muons to pileup interactions 5 GeV muons 100 GeV muons
Inclusive Fake Track Measurement • Ideally, the number of reconstructed tracks should scale linearly with the number of pileup events • An excess of reconstructed tracks is an indication that fake tracks are being found
Combinatoric Fakes • Can also observe fake tracks by looking at MC “truth” Combinatoric Fakes 1 Hit Mis-assigned Purity is the fraction of correctly assigned hits
Tracking Efficiency in High pT Jets • Tracking efficiency vs DR from jet axis • Two jet events with pT > 500 GeV, no pileup e=0.9 DR=0.01 DR
Fake Track Rate in High pT Jets • Jets by themselves do not generate fake tracks • Two jet events with pT > 500 GeV, no pileup 1 Hit Mis-assigned Purity (fraction of correctly assigned hits)
Effect of Pileup on Impact Parameter 2ev pileup 2ev pileup 50ev pileup 50ev pileup 100ev pileup 100ev pileup 150ev pileup 150ev pileup Z-impact w.r. MC vertex of tracks in jet R-impact w.r. MC vertex of tracks in jet Fast increase in number of tracks inside jet with big Z impact (pileup)
Summary • Simulation studies are crucial to having confidence in the tracker design as we enter a new regime in terms of hit density and small number of tracking layers • Upgrade Simulation working group is actively engaged • Several efforts using different tools allow us to take advantage of unique strengths of the different tools and provide cross checks • Preliminary results are starting to come in • Current focus is on developing common performance plots using each tool for a strawman tracker geometry • Some promising results – situation is not hopeless! • Optimization studies will follow once strawman performance baseline is established