Repeated Measures Designs
Repeated Measures Designs. In a Repeated Measures Design. We have experimental units that may be grouped according to one or several factors (the grouping factors) Then on each experimental unit we have not a single measurement but a group of measurements (the repeated measures)

Repeated Measures Designs
E N D
Presentation Transcript
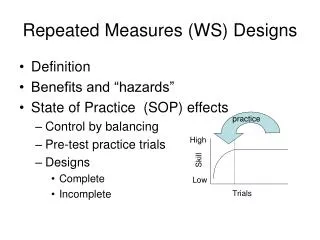
In a Repeated Measures Design We have experimental units that • may be grouped according to one or several factors (the grouping factors) Then on each experimental unit we have • not a single measurement but a group of measurements (the repeated measures) • The repeated measures may be taken at combinations of levels of one or several factors (The repeated measures factors)
Example In the following study the experimenter was interested in how the level of a certain enzyme changed in cardiac patients after open heart surgery. • The enzyme was measured • immediately after surgery (Day 0), • one day (Day 1), • two days (Day 2) and • one week (Day 7) after surgery • for n = 15 cardiac surgical patients.
The data is given in the table below. Table: The enzyme levels -immediately after surgery (Day 0), one day (Day 1),two days (Day 2) and one week (Day 7) after surgery
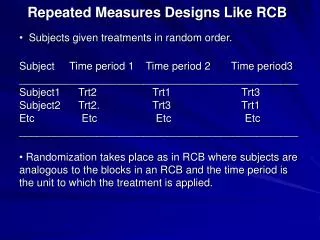
The subjects are not grouped (single group). • There is one repeated measures factor -Time – with levels • Day 0, • Day 1, • Day 2, • Day 7 • This design is the same as a randomized block design with • Blocks = subjects
The Anova Model for a simple repeated measures design Repeated measures y11 y12 y13 … y1t y21 y22 y23 … y2t subjects yn1 yn2 y13 … ynt
The Model yij = the jth repeated measure on the ithsubject = m + ai + tj + eij where m = the mean effect, ai = the effect of subject i, tj = the effect of time j, eij = random error.
The Anova Table for Enzyme Experiment The Subject Source of variability is modelling the variability between subjects The ERROR Source of variability is modelling the variability within subjects
The repeated measures are in columns Analysis Using SPSS- the data file
Specify the repeated measures factors and the number of levels
Specify the variables that represent the levels of the repeated measures factor There is no Between subject factor in this example
The Anova (univariate) Model yij = the jth repeated measure on the ithsubject = m + aj + tj + eij where m = the mean effect, aj = the effect of subject i, tj = the effect of time j, eij = random error.
Implications of The Anova (univariate) Model mj = the mean of y ij = m + 0 + tj + 0 = m + tj
The implication of the ANOVA model for a repeated measures design is that the correlation between repeated measures is constant.
The multivariate model for a repeated measures design Let denote a sample of n from the p-variate normal distribution with mean vector and covariance matrix S. Here Allows for arbitrary correlation structure amongst the repeated measures – yi1, yi2, … , yit
Repeated measures equal X … t 1 2 3 repeated measures
Let Then
The test for equality of repeated measures: Consider the data This is a sample of n from the (t – 1)-variate normal distribution with mean vector and covariance matrix .
Hotelling’s T2 test for equality of variables if H0 is true than has an F distribution with n1= t – 1 and n2= n - t + 1 Thus we reject H0 if F > Fawith n1= p – 1 and n2= n – t + 1
To perform the test, compute differences of successive variables for each case in the group and perform the one-sample Hotelling’s T2 test for a zero mean vector
Example In the following study the experimenter was interested in how the level of a certain enzyme changed in cardiac patients after open heart surgery. • The enzyme was measured • immediately after surgery (Day 0), • one day (Day 1), • two days (Day 2) and • one week (Day 7) after surgery • for n = 15 cardiac surgical patients.
The data is given in the table below. Table: The enzyme levels -immediately after surgery (Day 0), one day (Day 1),two days (Day 2) and one week (Day 7) after surgery
Example:(Repeated Measures Design - Grouping Factor) • In the following study, similar to example 3, the experimenter was interested in how the level of a certain enzyme changed in cardiac patients after open heart surgery. • In addition the experimenter was interested in how two drug treatments (A and B) would also effect the level of the enzyme.
The 24 patients were randomly divided into three groups of n= 8 patients. • The first group of patients were left untreated as a control group while • the second and third group were given drug treatments A and B respectively. • Again the enzyme was measured immediately after surgery (Day 0), one day (Day 1), two days (Day 2) and one week (Day 7) after surgery for each of the cardiac surgical patients in the study.
Table: The enzyme levels - immediately after surgery (Day 0), one day (Day 1),two days (Day 2) and one week (Day 7) after surgeryfor three treatment groups (control, Drug A, Drug B)
The subjects are grouped by treatment • control, • Drug A, • Drug B • There is one repeated measures factor -Time – with levels • Day 0, • Day 1, • Day 2, • Day 7
The Model yikj = the jth repeated measure on the ithsubject in the kth group = m + ak +ekj (1)+ tj+ (at)ki + ekij(2) where m = the mean effect, ak = the effect of group i, eij(1)= between subject error. tj = the effect of time j,
(at)kj = the group-time interaction effect eij(2)= within subject error.
The Anova Table There are two sources of Error in a repeated measures design: The betweensubject error – Error1 and the withinsubject error – Error2
Tables of means Drug Day 0 Day 1 Day 2 Day 7 Overall Control 118.63 77.88 60.50 55.75 78.19 A 103.25 68.25 52.00 51.50 68.75 B 103.38 69.38 54.13 51.50 69.59 Overall 108.42 71.83 55.54 52.92 72.18
The Multivariate approach to this data: • k = 3 samples from 4-variate normal distribution
Example: Repeated Measures Design - Two Grouping Factors • In the following example , the researcher was interested in how the levels of Anxiety (high and low) and Tension (none and high) affected error rates in performing a specified task. • In addition the researcher was interested in how the error rates also changed over time. • Four groups of three subjects diagnosed in the four Anxiety-Tension categories were asked to perform the task at four different times patients in the study.
The number of errors committed at each instance is tabulated below.