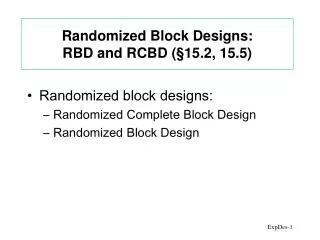
Randomized Block and Repeated Measures Designs
250 likes | 790 Vues
Randomized Block and Repeated Measures Designs. Block Designs. In the Types of Studies presentation we discussed the use of blocking to control for a source of variation we think may effect the response (e.g. slope in field, day, subject, etc.).

Randomized Block and Repeated Measures Designs
E N D
Presentation Transcript
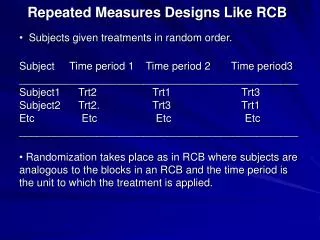
Block Designs • In the Types of Studies presentation we discussed the use of blocking to control for a source of variation we think may effect the response (e.g. slope in field, day, subject, etc.). • When the blocks are subjects we often times refer to the experiment as a repeated measures design because we are taking repeated measurements on the same subjects.
Example: Measuring Blood Serum The goal of this study was to determine if 4 different methods for determining blood serum levels differ in terms of the readings they give. Suppose we plan to have 6 readings from each method which we will then use to make our comparisons. One approach we could take would be to find 24 volunteers and randomly allocate six subjects to each method and compare the readings obtained using the four methods. (Note: this is a completely randomized design). There is one major problem with this approach, what is it? Any significant differences between the methods could be due to differences between the subjects within the methods and NOT the methods themselves !!!
Example: Measuring Blood Serum Instead of using a completely randomized design it would clearly be better to use each method on the same subject, This removes subject to subject variation from the results and will allow us to get a clearer picture of the actual differences in the methods. Also if we truly only wish to have 6 readings for each method, this approach will only require the use of 6 subjects (i.e. blood samples) versus the 24 subjects the completely randomized approach requires, thus reducing the “cost” of the experiment. Also if we still used 24 subjects the number of replicates 6 24, which increases POWERand PRECISION (i.e. smaller margins of error). i.e. SUBJECTS = BLOCKS.
METHOD Subject 1 2 3 4 1 360 435 391 502 2 1035 1152 1002 1230 3 632 750 591 804 BLOCKS Methods are used in a random order for each blood sample. 4 581 703 583 790 5 463 520 471 502 6 1131 1340 1144 1300 Example: Measuring Blood Serum • The design described on the previous slide is called a randomized complete block (RCB) design with subjects/blood sample as blocks. • The results are shown below:
Example: Measuring Blood Serum • An incorrect analysis would treat these results as coming from a completely randomized design and we would compare readings across method only using one-way ANOVA. Clearly between group variation is very small relative to within group variation. Not surprisingly we fail to find method differences(p = .7871).
Example: Measuring Blood Serum • What is lost in the previous analysis is that the same blood samples are being used for each method. Clearly much of the within group variation is due to subject differences! Our analysis needs to consider this source of variation as well! After removing the subject to subject variation the differences between the methods look like this. Clearly the methods differ!
Model and Assumptions • The model for the observed response is given by: • We assume that the errors are normally distributed with constant variance. • This implies that the populations being sampled are also normally distributed with equal variances!
Hypotheses Ho: treatment means are all equal HA: at least two treatment means differ For the blood serum level example we can state things much more precisely… Ho: the four methods give the same mean serum level when measuring the same blood samples. HA: at least two methods differ on average when measuring the same blood samples.
SS and MS Formulae The Mean Squares for Treatment, Block and Error are the SS divided by their df, i.e. MSeffect = SSeffect/dfeffect
Test Statistic for Treatment Effect Large values of Fo support the alternative and correspond to small p-values. p-value Fo
Example: Measuring Blood Serum • Data Formats JMP SPSS Subject and Method must be nominal!
Example: Measuring Blood Serum In JMP - Analyze > Fit Y by X Factor of interest goes here. Blocking factor goes here.
Example: Measuring Blood Serum The methods significantly differ when testing the same blood sample (p < .0001). • ANOVA Table Don’t test blocks because they are not randomized. MSTreat SSTreat + SSBlock = SSTotal + SSError = Fo MSError Subject to subject variation is LARGE! Blocking was effective!!
Example: Measuring Blood Serum Use Tukey’s for Pair-wise Comparisons of the Methods… Compare Means > All Pairs, Tukey’s HSD Methods 2 and 4 differ significantly from methods 1 and 3. Also methods 2 and 4 do not significantly differ nor do methods 1 and 3. These intervals can be used to quantify differences between the methods when measuring the same blood sample.
Example: Measuring Blood Serum In JMP - Fit Model Approach (we will use this lots later) Make sure these boxes are as shown. We will change them later when we consider multiple and logistic regression. Response Factors of interest go here. For a JMP demo of this and the previous approaches click here.
Example: Measuring Blood Serum SPSS: Analyze > General Linear Model > Univariate… Dependent Variable – Serum Level Fixed Factors: Subject (blocks) Method (factor of interest) Click here to specify the model Click Custom and add both Subject and Method to be in the model. Click here to specify Tukey comparisons of the different Methods.
Repeated Measures Analysis • The previous example can also be thought of as a repeated measures design because repeated measurements of the same blood sample were taken, each coming using a different method. • Another example would be a situation where different treatments are used on the same subjects, obviously this is not always possible. • Yet another common situation is where the repeated measurements are taken over time.
Example 2: ESR for Arthritic Patients • In a study of arthritic patients their response to sulfasalazine was investigated. • The erythocyte sedimentation rate (ESR) was measured at baseline (0 months) and again 3, 6, and 12 months after treatment with sulfasalazine. Q: Is there evidence that the mean ESR changes over time? If so, researchers wish to compare mean ESR for the three follow-up periods to baseline.
Mean ESR changes over time following treatment Example 2: ESR for Arthritic Patients The mean ESR is significantly lower than baseline for all three follow-up periods.
Example 2: ESR for Arthritic Patients There is no evidence that the mean ESR’s past baseline significantly differ. Use these Tukey intervals to quantify changes in mean ESR from baseline.
Example 2: ESR for Arthritic Patients • The response ESR appears to be normally distributed for each time period. • The equality of variance tests do not suggest that the variation in the ESR’s differ over time (p > .10).