Download
1 / 13
130 likes | 621 Vues
Repeated Measures Designs Like RCB. • Subjects given treatments in random order. Subject Time period 1 Time period 2 Time period3 _______________________________________________ Subject1 Trt2 Trt1 Trt3

E N D
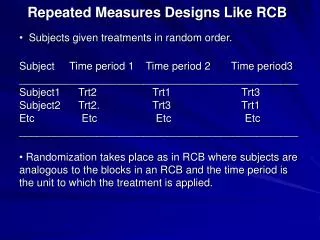
Repeated Measures Designs Like RCB • Subjects given treatments in random order. Subject Time period 1 Time period 2 Time period3 _______________________________________________ Subject1 Trt2 Trt1 Trt3 Subject2 Trt2. Trt3 Trt1 Etc Etc Etc Etc _______________________________________________ • Randomization takes place as in RCB where subjects are analogous to the blocks in an RCB and the time period is the unit to which the treatment is applied.
Mathematical model • Mathematical model • Model in general should include a random subject effect and a random subject*treatment interaction term. • If each treatment is done only once by the subject, then the residual and the subject*treatment term are the same. If subjects do the treatments more than once, then the subject by treatment interaction term will be the error term for testing for treatment effects. Yijk = + trti + subj + trt*subij + wijk trti = fixed treatment effect subj = random subject effect trt*subij = random subject by treatment interaction wijk = within subject error term when subjects do same treatment more than once
SAS STATEMENTS SAS statements PROC MIXED; CLASS TRT SUBJ; MODEL RESP = TRT; RANDOM SUB SUB*TRT; LSMEANS TRT/STDERR PDIFF;
Split-Plot Type Repeated Measures Designs • Split-Plot Type Repeated Measures Designs Same as design above except experimental units are in groups, and group effect is of interest. The groups themselves may represent different treatments, and the groups may be blocked or arranged in a Latin square. The group factor is the whole plot factor (called the between subjects factor). The several treatments that the subjects undergo within each group define the subplot factor or the within subject factor.
Examples • Examples • Subjects undergo three exercises (running, swimming, bicycling) in random order. The two groups are male and female • Same as above, but males and females blocked according to time of day the exercises are done. For instance, a male and female do all the exercises from 8 a.m. to 9 a.m., another male and female do all the exercises from 9 a.m. to 10 a.m. etc. • Subjects undergo three exercises (running, swimming, bicycling) in random order. Half the subjects are allowed to warm up before doing the exercises, the other half are not. Here the groups are formed by the pre-exercise routine that they carry out.
EXAMPLES CONTINUED • Cows given one of three diets, in random order (D1, D2, D3). Time is allotted between feedings so that effect of one diet does not affect the other. The cows are grouped according to 3 breeds. • Consumers given one of four food products to taste with the order of tasting being random. The consumers are groups according to gender.
SAS Code • SAS Code (grouping factor denoted as A, within subject factor denoted as B, ID is the identification number of the experimental unit PROC MIXED; CLASS A B ID; MODEL RESP = A B A*B; RANDOM ID(A); LSMEANS A B A*B / PDIFF; PROC MIXED; CLASS A B ID; MODEL RESP = A B A*B/DDFM = SATTERTH; REPEATED / TYPE = CS SUB = ID(A); LSMEANS A B A*B / PDIFF;
Practice exercise • Practice exercise. Workers are going to examine sheets of paper upon which certain diagrams are drawn. They will look for flaws in the diagrams under different conditions. The factors are intensity of light (low and high), angle of light (90 degrees, 45 degrees), and type of paper (glossy, dull). • Design the experiment as: completely random, randomized complete block, incomplete block, split plot with whole plot completely random, split plot with whole plot RCB, split-split plot. Note in setting the conditions for the experiment it is easy to change the type of paper, more difficult to change the angle of the light, and most difficult to change the light intensity as this requires changing the type of light bulbs in the lamps.
Split-plot type repeated measures designs where subplot factor cannot be randomized Two types of insecticide to be tested on plants (powder, liquid). We have 5 plants assigned randomly to each insecticide. Counts of insects are made at three fixed locations on the plants (top, middle, bottom). Insecticide effects, location effects, and insecticide by location interactions are of interest. • To carry out the analogy with split plot designs, then whole plot factor is insecticide and this is applied in a completely random design • Subplot or repeated measures factor is location. However, it cannot be randomized. So do we analyze this like a split-plot? or is there some other analysis that can be done? • In many cases the standard split-plot analysis will be satisfactory. However, I will show some alternatives.
The usual split plot analysis assumes constant correlation between locations (correlation between top and middle same as correlation between top and bottom, same as correlation between middle and bottom). • One alternative is to have an unstructured correlation, that is, all the correlations are estimated from the data. This is done with TYPE = UN in the REPEATED statement. • For what is available in SAS, go to help statement and search the index for MIXED PROCEDURE SYNTAX where you will find the use of the REPEATED statement and the TYPE option. • The output on the next page is a re-analysis of the data set given in class using TYPE=UN in the REPEATED statement. Compare this to the results of TYPE=CS.
Unstructured covariance in repeated measures procmixed; class ID A B; model resp = A B A*B/ DDFM = SATTERTH; repeated / TYPE = UN SUB = ID(A); run; The Mixed Procedure Model Information Data Set WORK.DATA5 Dependent Variable resp Covariance Structure Unstructured Subject Effect ID(A) Estimation Method REML Residual Variance Method None Fixed Effects SE Method Model-Based Degrees of Freedom Method Satterthwaite Class Level Information Class Levels Values ID 6 1 2 3 4 5 6 A 2 1 2 B 3 1 2 3
split plot type repeated measures The Mixed Procedure Covariance Parameter Estimates Cov Parm Subject Estimate The following e are the estimated covariances UN(1,1) ID(A) 0.04873 UN(2,1) ID(A) 0.03438 UN(2,2) ID(A) 0.03987 UN(3,1) ID(A) 0.01739 UN(3,2) ID(A) 0.02052 UN(3,3) ID(A) 0.01482 Null Model Likelihood Ratio Test DF Chi-Square Pr > ChiSq 5 10.16 0.0708
Type 3 Tests of Fixed Effects Results similar to standard split-plot analysi Num Den Effect DF F F Value Pr > F A 1 4 42.37 0.0029 B 2 4 420.59 <.0001 A*B 2 4 1.85 0.2699