Download
1 / 20
220 likes | 1.38k Vues
. . What is Shifting Cultivation?. Definition: FAO Forestry Department,

E N D
1. Slash and Burn Agriculture: Incorporating Shifting Cultivation into a Global Land Use Model for Earth System Model Applications Claire Plagge
Research & Discover Internship
Summer 2008
Good afternoon, My name is Claire Plagge. This summer I worked with Louise Chini, Steve Frolking, and George Hurtt on �Slash and Burn Agriculture: Incorporating Shifting Cultivation into a Global Land Use Model for Earth System Model Applications.� Shifting cultivation has been difficult to map and study, and in this project, I looked at a new way to model it globally. Good afternoon, My name is Claire Plagge. This summer I worked with Louise Chini, Steve Frolking, and George Hurtt on �Slash and Burn Agriculture: Incorporating Shifting Cultivation into a Global Land Use Model for Earth System Model Applications.� Shifting cultivation has been difficult to map and study, and in this project, I looked at a new way to model it globally.
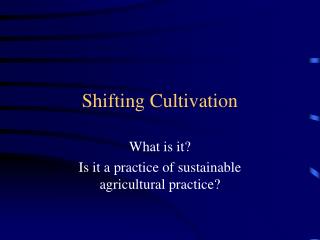
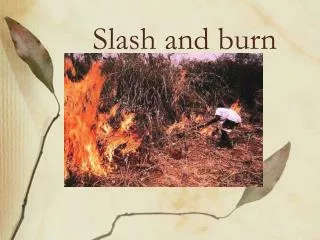
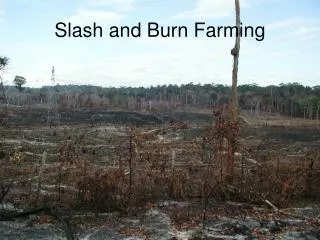
2. Shifting Cultivation is a form of agriculture, also known as slash-and-burn, or swidden agriculture, in which a plot of forest is cut down, burned, and allowed to dry before being cultivated continuously for several years, after which it is abandoned to revert to natural vegetation.
Point out pictures in each stage of shifting cultivation.Shifting Cultivation is a form of agriculture, also known as slash-and-burn, or swidden agriculture, in which a plot of forest is cut down, burned, and allowed to dry before being cultivated continuously for several years, after which it is abandoned to revert to natural vegetation.
Point out pictures in each stage of shifting cultivation.
3. Why is it important to study? Importance: livelihood for 200-500 million people, its existence impacts soil erosion rates, amount of canopy cover in tropical forests, global carbon cycle (Padoch et al 2007).
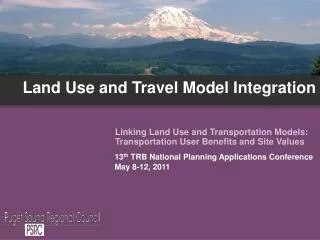
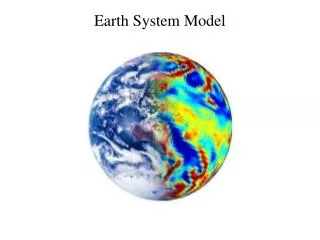
Model will be included in the global land use transitions model that provides input to Earth System Models simulating climate change
Shifting cultivation is an important form of agriculture because it remains the livelihood of 200-500 million people and affects not only local vegetation growth, erosion rates, and canopy cover in tropical forests, but also affects the global carbon cycle, and thus climate change. The model that I have been working on will be included in the global land use transitions model (Hurtt et al 2006) that provides input to Earth System Models that simulate climate change.
Shifting cultivation is an important form of agriculture because it remains the livelihood of 200-500 million people and affects not only local vegetation growth, erosion rates, and canopy cover in tropical forests, but also affects the global carbon cycle, and thus climate change. The model that I have been working on will be included in the global land use transitions model (Hurtt et al 2006) that provides input to Earth System Models that simulate climate change.
4. State of Current Research 36 case studies in Central and South America, central Africa, Southeast Asia, and China from a range of journals
Primarily focused on biological or ecological effects of shifting cultivation, several from a cultural viewpoint
Two large scale studies: Hall et al (1985) and Olofsson & Hickler (2007) During the course of my research, I looked at 36 case studies of shifting cultivation in Central and South America, central Africa, Southeast Asia, and China from a range of journals between 1937 and 2008. These studies focused primarily on biological or ecological effects of shifting cultivation, but several focused on cultural or economic aspects of the people involved. I focused on two large scale studies from which I took the basic equation that I used and several of the variables. These were Hall et al, which looked at area of shifting cultivation by country in Latin America, and Olofsson and Hickler, which created an equation for global fallow length. During the course of my research, I looked at 36 case studies of shifting cultivation in Central and South America, central Africa, Southeast Asia, and China from a range of journals between 1937 and 2008. These studies focused primarily on biological or ecological effects of shifting cultivation, but several focused on cultural or economic aspects of the people involved. I focused on two large scale studies from which I took the basic equation that I used and several of the variables. These were Hall et al, which looked at area of shifting cultivation by country in Latin America, and Olofsson and Hickler, which created an equation for global fallow length.
5. Key Findings Length of cultivation (1-4 years)
Fallow length (3-40 years with average of 5-10)
Cleared plot size (0.5-4.0 hectares on average)
Proximity to developed land (very rarely within 100 km)
Population involved (200-500 million), mostly animists/shamanists In researching the case studies, I found several patterns and ranges for the variables that I will be looking at. Most shifting cultivators farm their land for 1-4 years before leaving it fallow for 3-40 years, with an average fallow length of 5-10 years. This fallow length continues to decrease as population increases and land becomes less available. Most plots range from 0.5 to 4.0 hectares with the majority between 0.5 and 1 hectare. Because it is rare that shifting cultivation takes place near a developed area or any form of market, the people involved are tribal and have no contact with organized religion, thus remain animists. In researching the case studies, I found several patterns and ranges for the variables that I will be looking at. Most shifting cultivators farm their land for 1-4 years before leaving it fallow for 3-40 years, with an average fallow length of 5-10 years. This fallow length continues to decrease as population increases and land becomes less available. Most plots range from 0.5 to 4.0 hectares with the majority between 0.5 and 1 hectare. Because it is rare that shifting cultivation takes place near a developed area or any form of market, the people involved are tribal and have no contact with organized religion, thus remain animists.
6. Objective Goal: To create a model of shifting cultivation over time, as part of a larger land use model, based on the shifting cultivation area equation found in Hall et al (1985)
Used Hall equation, adapted to calculate for a gridded global map
Model placed on a 0.5? gridded global map
In this project I have attempted to create a model of shifting cultivation that will be added to a larger land use model. My model will be based on the shifting cultivation area equation found in Hall, but will be adapted to a gridded map of the world in which the area per grid cell will be calculated, rather than a region or country as used by Hall. This gridded map is a 0.5? map in which each grid cell ranges from 13.5 square kilometers to 3,000 square kilometers, with the largest cells at the equator. In this project I have attempted to create a model of shifting cultivation that will be added to a larger land use model. My model will be based on the shifting cultivation area equation found in Hall, but will be adapted to a gridded map of the world in which the area per grid cell will be calculated, rather than a region or country as used by Hall. This gridded map is a 0.5? map in which each grid cell ranges from 13.5 square kilometers to 3,000 square kilometers, with the largest cells at the equator.
7. Model for Area of Shifting Cultivation Asc : area of cultivation + fallow in shifting cultivation
As inputs change with time, the area of shifting cultivation will change with time The equation taken from Hall is the basis for the model that I have developed. Area_sc is the area of shifting cultivation plus the fallow lands, which changes over time as the inputs change with time. P is the population in each grid cell of the half degree grid. R is the fraction of that population that is rural. F_nonperm is a constant that shows the fraction of rural population that practices shifting cultivation. Those variables, multiplied by A-needed, or the area needed per person to practice shifting cultivation, are equal to the area of land farmed. To find the entire area of shifting cultivation, the equation is multiplied by the length of the fallow period plus the average 2 years of cultivation. The equation taken from Hall is the basis for the model that I have developed. Area_sc is the area of shifting cultivation plus the fallow lands, which changes over time as the inputs change with time. P is the population in each grid cell of the half degree grid. R is the fraction of that population that is rural. F_nonperm is a constant that shows the fraction of rural population that practices shifting cultivation. Those variables, multiplied by A-needed, or the area needed per person to practice shifting cultivation, are equal to the area of land farmed. To find the entire area of shifting cultivation, the equation is multiplied by the length of the fallow period plus the average 2 years of cultivation.
10.
Aneeded : (constant) area needed per person for shifting cultivation
Aneeded was estimated at 1/6 hectare based on the average found in the case studies, also the number given by Olofsson & Hickler 2007 The population data was taken from the HYDE data in Klein Goldewijk, but the fraction of population involved (F_nonperm) was found in Olofsson and Hickler. F_nonperm was estimated as 20% of the world population between 1700 and 1800, decreasing to 15% until 1970, and then again to 11% between 1970 and 1990, and 10% by 2000. Also in Olofsson was the area needed per person, estimated at 1/6 hectare. The fallow period decreased from 8 years in 1970 to 5 years in 2000 based on the averages found in my case studies. The +2 was added to be the average length of cultivation as shown by the case studies. The population data was taken from the HYDE data in Klein Goldewijk, but the fraction of population involved (F_nonperm) was found in Olofsson and Hickler. F_nonperm was estimated as 20% of the world population between 1700 and 1800, decreasing to 15% until 1970, and then again to 11% between 1970 and 1990, and 10% by 2000. Also in Olofsson was the area needed per person, estimated at 1/6 hectare. The fallow period decreased from 8 years in 1970 to 5 years in 2000 based on the averages found in my case studies. The +2 was added to be the average length of cultivation as shown by the case studies.
12. Shifting Cultivation Location Potential vegetation biomass density > 2 kg C/m2 (this is a rough threshold for forested land)
1 persons/km2 < Population Density < 100 persons/km2
Fraction of urban land per grid cell < 20%
Fraction of pasture land per grid cell < 40 %
Area of �natural vegetation� land km2 (as given by HYDE) > 5*Area of cropland km2
World share of GDP per capita < 0.3e-7
Average winter temperature (in February) > -9?C
Area_sc ? Crop area Because the Hall equation was designed for small regions, not for global applications, I had to make some adjustments. After creating the equation and mapping the results, I found that the area given for shifting cultivation was much too large, and was showing places like Virginia and France as locations of shifting cultivation. Shifting cultivation takes place in limited areas: those with low population density, large rural areas with a very low urban population, and forested areas. Therefore, I had to add another equation to the model that would limit the areas of shifting cultivation to those logical and possible. I used the information in the case studies, and even the locations themselves to judge where shifting cultivation would occur, and to narrow down places I knew it did not. Thus, this new equation was used as a �mask�, meaning it was overlaid on the original equation to remove �wrong� areas. This mask consisted of variables such as potential vegetation biomass density, population density, fraction of land already in use, GDP, and winter temperatures. Because the Hall equation was designed for small regions, not for global applications, I had to make some adjustments. After creating the equation and mapping the results, I found that the area given for shifting cultivation was much too large, and was showing places like Virginia and France as locations of shifting cultivation. Shifting cultivation takes place in limited areas: those with low population density, large rural areas with a very low urban population, and forested areas. Therefore, I had to add another equation to the model that would limit the areas of shifting cultivation to those logical and possible. I used the information in the case studies, and even the locations themselves to judge where shifting cultivation would occur, and to narrow down places I knew it did not. Thus, this new equation was used as a �mask�, meaning it was overlaid on the original equation to remove �wrong� areas. This mask consisted of variables such as potential vegetation biomass density, population density, fraction of land already in use, GDP, and winter temperatures.
13. The Modeling Process After creating the new model �mask�, I placed it over the original shifting cultivation model and created a new map that showed the total area of shifting cultivation globally in kilometers squared per grid cell. All of the modeling and mapping was completed using MATLAB and the MATLAB mapping toolbox. The resulting map showed the area of total shifting cultivation, including fallow lands. Then I had to find the area of shifting cultivation actually being cultivated by dividing the total area by the total cultivation period. Thus, the final map is one of the area in square kilometers cultivated under shifting cultivation.
After creating the new model �mask�, I placed it over the original shifting cultivation model and created a new map that showed the total area of shifting cultivation globally in kilometers squared per grid cell. All of the modeling and mapping was completed using MATLAB and the MATLAB mapping toolbox. The resulting map showed the area of total shifting cultivation, including fallow lands. Then I had to find the area of shifting cultivation actually being cultivated by dividing the total area by the total cultivation period. Thus, the final map is one of the area in square kilometers cultivated under shifting cultivation.
14. Results:The Cultivated Area Map This final map shows not only the location of shifting cultivation, which is shown here with the case study locations overlaid to show the approximate correctness of the model, but also the amount of shifting cultivation in each grid cell in kilometers squared.This final map shows not only the location of shifting cultivation, which is shown here with the case study locations overlaid to show the approximate correctness of the model, but also the amount of shifting cultivation in each grid cell in kilometers squared.
15. Results: Table of Values Thus, it is possible to generate global estimates for total cultivated area, total population involved in shifting cultivation, and total shifting cultivation area including fallow lands. Our model is shown with several other estimates of shifting cultivation areas and populations from previous years. While our numbers are somewhat lower than those of the other studies, all of my research indicates that shifting cultivation continues to decrease both in area of land and in number of people participating.
Try finding 1970 totals!!!!!Thus, it is possible to generate global estimates for total cultivated area, total population involved in shifting cultivation, and total shifting cultivation area including fallow lands. Our model is shown with several other estimates of shifting cultivation areas and populations from previous years. While our numbers are somewhat lower than those of the other studies, all of my research indicates that shifting cultivation continues to decrease both in area of land and in number of people participating.
Try finding 1970 totals!!!!!
16. Extending the Model Use our model to predict the area of shifting cultivation back to 1700 or before, as far back as the constraints and variables are available
Use our model to predict the future area of shifting cultivation, and possibly when it ceases to exist
Larger model: included in Global Landuse Model (Hurtt et al 2006), our model will be used as an input to better quantify landuse transitions This model has only been calculated from 1970 to 2000 because of time and data constraints. However, if data sets are available, this model can be used to generate estimates of the area of shifting cultivation back to 1700 or even BC era with some adjustments to the constants in the model, and to predict the future area of shifting cultivation, up to the point where it ceases to exist. The model can also be placed into a larger model, known as the Global Landuse Model, which simulates data for landuse transitions and changes. Our model would be used as an input to better quantify the global landuse transitions within shifting cultivation. It will also be possible to predict future landuse transitions and their effects on the Earth system using future estimates of this model as an input. This model has only been calculated from 1970 to 2000 because of time and data constraints. However, if data sets are available, this model can be used to generate estimates of the area of shifting cultivation back to 1700 or even BC era with some adjustments to the constants in the model, and to predict the future area of shifting cultivation, up to the point where it ceases to exist. The model can also be placed into a larger model, known as the Global Landuse Model, which simulates data for landuse transitions and changes. Our model would be used as an input to better quantify the global landuse transitions within shifting cultivation. It will also be possible to predict future landuse transitions and their effects on the Earth system using future estimates of this model as an input.
17. The Next Steps Further define Fnonperm, dependent on constraints, not a constant
Get datasets back to 1700/1500 and predictions up to 2100 to expand the model and find patterns in shifting cultivation land use change
Use socio-cultural variables (such as religion) as a constraint
However, there are several ways to continue perfecting this model. Many of the variables used in both models were based on educated guesses of averages from the case studies researched. To improve the model, all of the constants, could be further defined, for example, F_nonperm could be shown as dependent on the constraints of the second model, rather than a constant. To strengthen the model, data sets back to 1700 or earlier could be added into the model, along with predictions for the future of shifting cultivation. There is also the possibility of not only including mathematical, biological, and economic variables, but also those of a socio-cultural nature, such as the location and change of world religions (remember that shifting cultivators practice tribal religions). There are many ways to advance this model, what we have completed this summer is just the beginning. However, there are several ways to continue perfecting this model. Many of the variables used in both models were based on educated guesses of averages from the case studies researched. To improve the model, all of the constants, could be further defined, for example, F_nonperm could be shown as dependent on the constraints of the second model, rather than a constant. To strengthen the model, data sets back to 1700 or earlier could be added into the model, along with predictions for the future of shifting cultivation. There is also the possibility of not only including mathematical, biological, and economic variables, but also those of a socio-cultural nature, such as the location and change of world religions (remember that shifting cultivators practice tribal religions). There are many ways to advance this model, what we have completed this summer is just the beginning.
18. Role of Remote Sensing Shifting cultivation plays role in creation of active fires that are measured by remote sensing
Fields too small for global instruments like MODIS, use local/regional studies with Landsat or Ikonos to observe shifting cultivation plots
This model of shifting cultivation can be closely related to the field of remote sensing. It is possible to extend this model to look at the active fires taking place in areas of shifting cultivation through remote sensing data. While many times the areas are too small to be seen with global instruments, regional studies with Landsat and Ikonos could aid in further shifting cultivation case studies. This model in particular could be of use in interpreting the measurements gathered by the proposed NASA satellite DESDynI, which will map forest canopy structure and biomass. However, problems that could arise are the frequent cloud cover found over tropical forests and the highly dynamic landscape, which could make it difficult to differentiate between shifting cultivation and small scale logging for example. This model of shifting cultivation can be closely related to the field of remote sensing. It is possible to extend this model to look at the active fires taking place in areas of shifting cultivation through remote sensing data. While many times the areas are too small to be seen with global instruments, regional studies with Landsat and Ikonos could aid in further shifting cultivation case studies. This model in particular could be of use in interpreting the measurements gathered by the proposed NASA satellite DESDynI, which will map forest canopy structure and biomass. However, problems that could arise are the frequent cloud cover found over tropical forests and the highly dynamic landscape, which could make it difficult to differentiate between shifting cultivation and small scale logging for example.
19. Acknowledgements This summer I have engaged in a study that aims to quantify more explicitly where SC is occurring and how much land is involved and hopefully this study will continue to be improved to aid in the larger research of changing landuse and how it affects the Earth system.
Thank you. Are there any questions?
Potential questions:
Main Earth system model being used is the Princeton GFDL.This summer I have engaged in a study that aims to quantify more explicitly where SC is occurring and how much land is involved and hopefully this study will continue to be improved to aid in the larger research of changing landuse and how it affects the Earth system.
Thank you. Are there any questions?
Potential questions:
Main Earth system model being used is the Princeton GFDL.
20. Pictures 1. http://exploringafrica.matrix.msu.edu/students/curriculum/m9/activity2.php
2. http://www.natureproducts.net/Agriculture/shifting_cultivation.html
3. http://concise.britannica.com/dday/print?articleId=111207&fullArticle=true&
tocId=46122
4. http://www.geolinde.musin.de/afrika/html/t_afr_shifting.htm
5. http://www.megsoil.gov.in/shifting_cul.htm
6. http://www.fao.org/DOCREP/006/AD077E/AD077e04.htm
7. http://earthobservatory.nasa.gov/Newsroom/NewImages/images.php3
?img_id=17423
8. http://www.geolinde.musin.de/afrika/html/t_afr_shifting.htm