Download
1 / 29
290 likes | 410 Vues
This presentation focuses on the reimplementation of MetroScope, a vital land use planning and transportation model used by Portland's Metro. Originally developed in-house, MetroScope assists in analyzing housing needs, transportation planning, and regional transportation plans. Changes include upgrades to visual programming and open-source coding, enhancing its capabilities for testing alternative land use and transportation policies. The talk also explores MetroScope's operations, structure, and compatibility with other metropolitan planning organizations, highlighting its significance in urban development and real estate simulation.

E N D
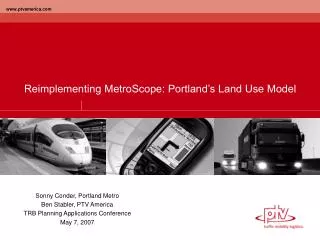
Reimplementing MetroScope: Portland’s Land Use Model Sonny Conder, Portland MetroBen Stabler, PTV AmericaTRB Planning Applications ConferenceMay 7, 2007
Presentation What does Metro use MetroScope for? MetroScope in brief Background of MetroScope Present MetroScope operating requirements Testing MetroScope for use elsewhere MetroScope described in a bit more detail: Short course on model labels MetroScope structure MetroScope details – some examples MetroScope results – some more examples Re-implementation
What does Metro use MetroScope for? • Transportation Planning • Corridor Studies • Regional Transportation Plan (RTP) • Transit Studies (e.g., Light Rail) • Land Use Planning • Jobs and Housing Needs Analysis • Periodic Review • UGB analysis • Testing Alternative Land Use & Transportation Policies
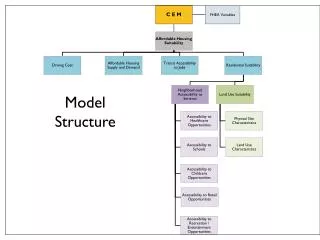
HIA Demand Forecast Travel Times/Access (Travel Demand Model) Job Demand Forecast HIA location choices Job location choices Job Location Choices Metroscope Residential Model Metroscope Non-Residential Model HIA Location Choices Land Supply / Capacity Data Vacant Land, Refill Supply, UR etc. Metroscope Schematic
Background of MetroScope • Originally one zone residential model used for housing needs analysis • 1996 – 1997: Developed entirely “in house” by Metro technical staff • 1998: Multi-zones added • 1999: Non-residential model added • 2001 – 2002: Partial conversion from entirely spreadsheet to Visual Basic • 2004: Complete Visual Basic • 2005: Addition of internal travel demand – assignment model (PTV) • 2006: Conversion to open source R code (PTV) • 2006: Database and programming integration as one model (PTV)
Present MetroScope Operating Requirements • Model operates in 5 year periods from year 2000 to 2035. A 35 year run requires 36 hours. • Staff time required per run for model. • Model operation: Less than 1 staff hour for review, initiation and run time monitoring • Run setup: 2 – 6 staff hours for land use schedules by period – UGB expansions, Urban Renewal births/deaths. • Run output evaluation and reporting: 1 – 21 staff days depending on use, mapping and write up needs.
Testing MetroScope for use elsewhere • Can MetroScope now be set up and be useful to a middle to large sized MPO? • How much effort to set it up? • How much effort to run and maintain it? • Proposal for testing in other MPO’s (Lane County – Mid Willamette ??) • MPO supplied – Land use by rzone by zoning category both vacant and refill; employment geocode by ezone by type class; travel network. • Other data from published sources or Metro default. • Set up accounting system for measured test of time and personnel required for implementing and using MetroScope in 3 – 6 test runs.
MetroScope in a bit more detail (Indulging my whimsical side a bit…) • For the label thirsty: MetroScope - a 130 year old Walrasian/Paretian, demand and supply, aggregate, static, partial equilibrium model…Did I forget deterministic? • What no micro-simulated, discrete, bid rent, neural network, dynamically disequilibrated randomly walking processes? • NO…But believe me – humble is hard enough!
MetroScope Simulates the Development of Urban Real Estate – Meaning What? • Incorporates a theoretical structure to determine the general character and number of equations and what arguments are determined within the model (endogenous) and outside the model (exogenous). • Not nearly as rigorous as purely theoretical models so equations must have statistically measured weights (parameter estimation) attached to their arguments. • Estimated equations need to be tested against range of variable arguments and compared to literature and common sense. (sensitivity testing). • Full system of estimated equations and logical accounting identities need to be “conditioned” to the initial measurements (year 0) of the region. (calibration). • Model needs to be repeatedly run in forecast mode with wide range of input assumptions. (destructive testing).
Structure Housing Theoretical – MetroScope Gen 3.0 Subject to: Profit (supply) function Subject to: Determined quantities:
MetroScope Housing Consumption Function – More than you ever want to know • 4 Types of Housing – OSFD,OMFD,RSFD,RMFD in 8 value categories, 425 Rzones, 400 HIAK’s distributed from 72 Ezones. • House tenure = f(HIA, Price of good, price of substitute,price of complement, frequency) • House type = f(HIA, price of good, price of substitute, price of complement, frequency) • House location = f(HIA, travel time, neighborhood, frequency of type and value category, price of good) • Choice problem: allocate 1,335,000 households among 391,680,000 possible states.
MetroScope Housing Supply Function – shorter because we don’t know much • 4 Types of Housing in 425 Rzones in up to 30 zoning density categories by vacant, refill, urban renewal, ugb adds and rural residential land sources. • Housing Cost = f(lot size,house size, cap cost per sq. ft. by density, type, location, land cost per sq. ft by type, location, density, SDC’s) • Housing production function: CES
MetroScope Equilibrium Solution • Residential, nonresidential and transportation modules solved for equilibrium condition once every 5 years. • Residential solution find Price for 425 zones and 4 housing types that min (S-D)SQR (75 iterations). • Nonresidential solution find Price for 72 zones in 6 real estate types that min (S-D)SQR (75 iterations). • Travel model change in O-D travel time less than a specified constant.
Travel Logit / Demand No Transit / Transit / Land peak-period Activity-based Model mode split no logit (24 hr) Use assignment Model None Activity + Judgement Non-market-based Land Allocation Land allocation w/ price signals Fully integrated market-based model Actual Agency Development Path Portland Metro Agency Development Path
Forecast Allocation Area 6.5 counties 2 m pop 425 rzones 72 ezones 2029 taz’s Clark Co. Washington Co. Multnomah Co. Tailored to allocate growth to UGB, but also anticipates external “leakage” Clackamas Co.
Re-Implementation • The old implementation: • Some calculations in Excel • Res and Non-Res Models in VB6 • Transportation Model in R & EMME/2 • Parcel accounting in Access • Data stored in CSV files • Data transfer via files and email • The new implementation: • Database • One programming language • Completely automated model runs • Scenario management
Tools • Metro required open source tools: • Database – PostgreSQL 1) Mature open source DB 2) ODBC driver 3) PostGISProgramming Language – R 1) Specifically for data analysis 2) Dialect of S (written in C/C++) 3) Vectorized 4) Statistical 5) Interpreted 6) COM Interface (rcom) www.postgres.org www.r-project.org
Tools • Travel Demand Model: • Trip Generation, Trip Distribution and Mode Choice in RAssignment and Visualization in PTV Vision - VISUMCommunication via the COM interfaceMatrix I/O via R library visumR - reads/writes compressed binary format
Implementation • Inputs in CSV format (except networks) • DB schema in standard SQL for semi DB independence (no complex data types) • R controls the entire process (and is the core interface) • DB on Metro’s Postgres server, while R and VISUM run on a Windows desktop • Access hook via ODBC to Postgres DB for custom outputs • GUI for managing scenarios, inputs, outputs and running the model
{ nonResModel(50) resModel(50) nonResModel(50) resModel(50) transModel(3) x2 Implementation • Design goal of one day turnaround for model runsPreviously 2 week turnaround50 iterations to balance supply and demandRedesign: 1) ~ 6 hours for 1 run of one time step 2) ~ 48 hours for a 40 year runThe RES location choice model consumes ~ 50% of the run time Time step n x8 for 40 years
Reimplementation Conclusions • Integration of all modules enables quick turnaround on model runsThe benefits of automated accounting are very important (central open DB that stores everything)Knowledge transfer of database design, programming, and model framework/structureOpen source so other agencies can utilize the model
Questions • Sonny Conder, Metro, conders@metro.dst.or.us • Ben Stabler, PTV America, bstabler@ptvamerica.com