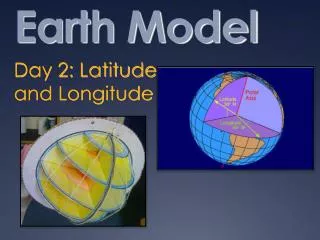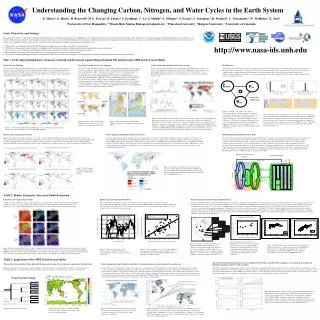
Earth System Model
Earth System Model. Beyond the boundary. Model. A mathematical representation of the many processes that make up our climate. Requires: Knowledge of the physical laws that govern climate Mathematical expressions for those laws
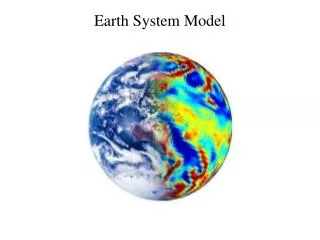

Earth System Model
E N D
Presentation Transcript
Model • A mathematical representation of the many processes that make up our climate. • Requires: • Knowledge of the physical laws that govern climate • Mathematical expressions for those laws • Numerical methods to solve the mathematical expressions on a computer (if needed) • A computer of adequate size to carry out the calculations
Why? Hypotheses Observations NumericalSimulations • Understanding of causeand effect • Predictiveskill: ourmain tool to make predictionsfor the future
Definition There is no unique definition of which processes must be represented before a climate model becomes an Earth System Model (ESM), but typically such models have at least an interactive carbon cycle component. The development of this capability was motivated by suggestions that the ability of terrestrial ecosystems and the ocean to remove carbon dioxide from the atmosphere will be limited by future climate change (e.g., Friedlingstein et al. 2006).
Climate-Carbon Feedback [Friedlingstein et al. 2006]
Climate-Carbon Feedback Positive feedback if the warming leads to enhanced rates of decay of organic matter in soils, or a reduction in oceanic carbon uptake, then the concentration of CO2 in the atmosphere will rise more rapidly than it would in the absence of such (positive) feedbacks, and the rate of warming will be greater as well. if increased CO2 in the atmosphere enhances photosynthesis and the storage of carbon in plants and soils, then CO2 levels will rise less rapidly than in the absence of this (negative) feedback, and climate change will also be slower as a result. Negative feedback
Earth System Model (ESM) Atmospheric circulation and radiation Climate Model Sea Ice Land physics and hydrology Ocean circulation Atmospheric circulation and radiation Allows Interactive CO2 Earth System Model Sea Ice Plant ecology, land use, and Biogeochemistry Ocean ecology and chemistry Land physics and hydrology Ocean circulation
Carbon cycle CO2 CO2 Diagnostic Prognostic Global Climate Model Earth System Model
Multi-disciplinary Science Terrestrial ecosystems influence climate through physical, chemical, and biological processes that affect planetary energetics, the hydrologic cycle, and atmospheric composition Earth system science spans traditional disciplines • Three examples • Anthropogenic land cover change • Photosynthesis-transpiration • Leaf area index Bonan (2008) Ecological Climatology, 2nd ed (Cambridge Univ. Press)
Vegetation dynamics Broadleaf Tree Shrub C3 Grass Soil Plant functional type (PFT) Deciduous, evergreen trees Shrub Grass Crop Competition (10 days)
Phenology LAI (Model)
Annual cycle of LAI in ESMs Observation (GIMMS New LAI) Amplitude of LAI annual cycle climatology (1982-2005) [Jeong et al., in preparation]
Uncertainties in phenology [Optimal parameterization] [parameter] [structure] [hypothesis] [species] [DGVM group1] Net ecosystem productivity [DGVM group2] EX 4m EX 5m Day of year Budburst date Carbon uptake commencement Parameter: -1.2 days -1.0 days Structure: -0.5 days - 0.0 days Hypothesis: -1.5 days -2.0 days Species: -9.7 days -11.5 days DGVMs: -9.2 days -11.1 days [Jeong et al., 2012]
Potential solution Species Early Mid Late successional species [Jeong et al., 2013b; Jeong and Medvigy, in review]
New paradigm “ecological realism”
Crop phenology Phase 2 Phase 3 Phase 1 LAI Grain Fill Harvest Planting date 0 Leaf Emergence Time Green: climate, fertilization, and irrigation Red: human-decision
Tradeoff between food benefit and climatic cost Global Climate Model (one way) 1. Extensification (land use) 2. Intensification (Irrigation, fertilization, practices) 1. Extensification (land use) 2. Intensification (Irrigation, fertilization, practices) 3. Interactive crop management (planting, harvesting) Earth System Model (two way)
Current problem NCAR CESM 1.0 algorithm Sacks et al., 2010 Wheat
Potential solution [Jeong et al., 2013a]
Summary We need more efforts to implement ecological realism in ESMs. Human-managed phenology is the initial stage. We need systematic analysis on phenology and atmospheric CO2 by integrating satellite, ground, and Earth system model. How will changes in phenology affect the variations in annual cycle of atmospheric CO2? Vegetation Activity CO2 Concentration