Overview of CORINE 2006 Land Cover and Ecosystem Services Data for European Countries
This document presents visualizations and updates from the CORINE 2006 dataset, detailing land cover, land use, and the relationship between natural capital and ecosystem services across European countries. Key figures depict changes in land cover from 1990 to 2006, highlighting trends in artificial surfaces, agriculture, forests, and wetland areas. The text elaborates on the definitions of land cover, land use, natural capital, and ecosystem services, emphasizing their importance for human well-being and sustainable development.

Overview of CORINE 2006 Land Cover and Ecosystem Services Data for European Countries
E N D
Presentation Transcript
EEA 2006 Accounts Update Figures and tables
Figure 1.1 CORINE 2006 update (newer version?) European Countries for which CORINE 2006 data are available
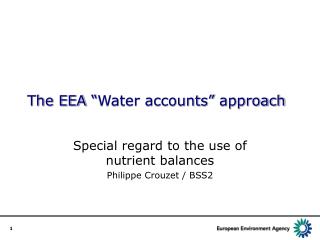
Figure 1.2: Land Cover, Land Use and Natural Capital Ecosystem services Ecosystem services Land and ecosystem functions Human well-being Human well-being Where: Land cover is the physical characteristics of the land surface determined by both its biotic and abotic features. • Land use is determined by the purposes of active and passive management of land by people and the material non-material benefits they derive from it. • Natural Capital is includes natural resource stocks, land and ecosystems, as well as biodiversity which is the variety of ecological elements present in a place (genes, species, communities and habitats, etc.). • Land and ecosystem functions are the potentials or capacities that land and ecosystems have to generate useful outputs for people. • Ecosystem services are the specific and final contributions that ecosystems make to human well being.
Figure 1.3: Flow accounts for land cover and the relationship between the concepts of stocks and flows and fundamental questions about sustainable development
Figure 1.4: Land and Ecosystem Capital Relationships (after JLW, 2010)
Figure 1.5 a&b: Maps of urban temperatures and GBI [DO THESE NEED TO BE UPDATED WITH 2006 DATA OR WILL 2000 DO? – WE MAP CHANGE LATER] b a
Figure 2.4 Is there a map equivalent to for 2000-2006?
Figure 2.6 Percent change in forest area as a result of forest creation (LCF7) as a proportion of 2006 forest area [perhaps 2000 area is better?]
Figure 2.7 Land cover flows by country (NUTS0)[CAN WE ADD 1990-2000 FLOWS TO THESE GRAPHS?]
Figure 2.8: Land cover flows by biogeographic zone [CAN WE ADD 1990-2000 FLOWS TO THESE GRAPHS?] Figures in ha/yr to assist comparison
Figure 2.9: Land cover flows by major elevation zone [CAN WE ADD 1990-2000 FLOWS TO THESE GRAPHS?]; Figures in ha/yr to assist comparison
Figure 2.10 Changing urban temperatures NOTE THE TITLE OF THIS IS WRONG... – IT IS URBAN
Figure 2.11 Changes in pressures from intensive agricultural activities
Figure 2.12: areas where urban sprawl between 2000 and 2006 has been detected.
Figure 2.18: Overview of land cover changes (1990-2006) for 25 European countries covered by CLC2006 (figures in km2) Artificial surfaces 18148 1990-2000 1593 755 273 4694 3831 Artificial surfaces Agriculture Forest, semi-natural open dry land, wetland and water bodies 5252 2000-2006 1650 363 Should we calculate the 1990 data for the same courtiers as the 2006 data are available for – should we have average transfer per year? 244 2255 1967 Forest, semi-natural open dry land, wetland and water bodies Agriculture
Figure 3.8 - Method of assigning DLT using Dominant land cover Needs redrawing and explaining as flow diagram?
Figure 4.3 Proposed structure and design of national, satellite and ecosystem accounts
Figure 4.4: Conceptual framework for development of a common classification of ecosystem services
Figure 4.5: Conceptual Framework for the Fast Track Ecosystem Capital Iniative.
Figure 4.8: Proposed methodology for calculation of biodiversity index.