Energy Flows and feedback processes: A systems perspective
630 likes | 665 Vues
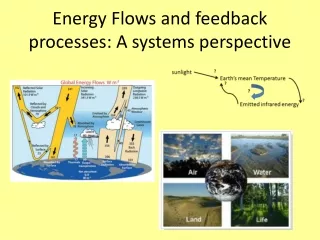
Learn how to create and analyze systems diagrams focusing on Earth's climate system. Discover the connections between variables like Absorbed Sunlight, CO2, Water Vapor, and more. Practice drawing system diagrams to describe complex feedback processes.

Energy Flows and feedback processes: A systems perspective
E N D
Presentation Transcript
Blue slides will have corresponding questions in the student handout
From last time • Your prediction: If rising CO2 increases temperature, how will this change evaporation (and H2O) in the atmosphere? How do you think earth’s temperature will respond? • Take a minute to jot down your ideas in the space below, compare with your neighbor and revise as appropriate, and then be prepared to share with the class.
What do you know? Have you ever learned how to create and use systems diagrams (causal loop diagrams)? ____Yes ___No If yes, how would you rate your understanding of creating and using them? Very poor 1 2 3 4 5 Expert
Systems Diagrams Our goal today is to learn how to create and analyze systems diagrams, with emphasis on Earth’s climate system as well as their generic applicability.
Review slide Earth’s Energy Balance is used here to develop and explain causal loop diagrams.
Absorbed Sunlight Earth’s Mean Temperature Planetary albedo Earth’s Mean Temperature Emitted Infrared Earth’s Mean Temperature Water Vapor Earth’s Mean Temperature CO2 Earth’s Mean Temperature Cloud cover Earth’s Mean Temperature Connections (+ or - ??)**put a + or – near the tip of the arrow to indicate whether the connection between the two climate system variables is positive or negative. System variables should be nouns (Earth’s Temperature rather than warming.) ** A connection is positive if when the first increases the second also increases, and a connection is negative (opposite) if when the first increases the second decreases.
Absorbed Sunlight + Earth’s Mean Temperature Planetary albedo - Earth’s Mean Temperature Emitted Infrared - Earth’s Mean Temperature Water Vapor + Earth’s Mean Temperature CO2+ Earth’s Mean Temperature Cloud cover + or -Earth’s Mean Temperature Connections (+ or - ??)*put a + or – near the tip of the arrow to indicate whether the connection between the two climate system variables is positive or negative. use nouns * A connection is positive if when the first increases the second also increases, and a connection is negative (opposite) if when the first increases the second decreases.
A system diagram What are the missing connections? + or -
A system diagram: identifying feedback structure See Appendix 1 for further discussion of water vapor feedback.
Slides on clouds and climate from Appendix 2 could be inserted here but would likely make this lesson exceed a normal 50 minute session.
A Challenge • Draw a systems diagram to describe the following: • The sun becomes brighter causing Earth to warm. As the Earth warms it gives off more longwave radiation until it settles into a new equilibrium temperature. • Your diagram should have the sun’s brightness as an external driver to Earth’s temperature and Earth’s Temperature connected with emitted longwave (infrared*) radiation. * Infrared radiation emitted from Earth or its atmosphere is also referred to as longwave or terrestrial radiation.
A first Challenge: diagram structure • Draw a systems diagram to describe the following: • The sun becomes brighter causing Earth to warm to a new equilibrium temperature. sunlight ? Earth’s mean Temperature ? ? ? Emitted infrared energy Notice that the sun is not within the feedback loop structure. What are the missing connections? + or – and is the loop a positive or negative feedback loop
A first Challenge: completed diagram • Draw a systems diagram to describe the following: • The sun becomes brighter causing Earth to warm to a new equilibrium temperature. sunlight + Earth’s mean Temperature - - + Emitted infrared energy Notice that the sun is not within the feedback loop structure. This negative feedback loop is always present in the Earth System and helps limit (or balances) the runaway effects of positive feedback processes.
Ice albedo feedback process As Earth’s temperature increases from increased solar radiation output there will be less snow and ice cover globally. This decreases the planetary albedo causing even more sunlight to be absorbed by the climate system resulting in amplified warming. Again solar output (or intensity) is an external driver and will not be within the loop structure. A systems diagram capturing the essence of the feedback process is shown on the next slide.
Ice albedo feedback. Diagram StructureWhat is the polarity (sign) of each connection? 1. 2. 3. 4. 5.
What are the polarities of each connection?What is the sign (polarity) of this feedback loop? 1. + 2. - 3. + 4. - 5. + + + - - +
Is this a Positive or Negative feedback loop? 1. + 2. - 3. + 4. - 5. + What is the sign of this feedback loop? Positive When the number of negative connections in a causal loop is even then the loop is positive, odd then the loop is negative. + + - + - +
It is important to realize that the negative feedback loop between Earth’s temperature and emitted terrestrial radiation is always present. This limits limits/balances the positive feedback.
The terms positive and negative feedbacks have no reference to the value (good or bad) of the feedback. They are often referred to as amplifying and balancing feedbacks. Sometimes the results of positive feedbacks are characterized as “spiraling out of control” or the “snow ball effect”.
Two new connectionsAre the connections positive or negative? Earth’s surface temperature ? CO2 solubility in oceans CO2 solubility in oceans ? Atmospheric CO2
Two new connectionsAre the connections positive or negative? Earth’s surface temperature - CO2 solubility in oceans CO2 solubility in oceans - Atmospheric CO2
Complete the causal loop diagram below. Make sure to label all connections as + or – and also determine whether the whole loop is a positive or negative feedback loop.
Complete the causal loop diagram below. Make sure to label all connections as + or – and also determine whether the whole loop is a positive or negative feedback loop. + - + + -
The figure above shows 5 components of a systems diagram intended to show the interconnections between key factors driving climate change policy. • Take a minute to think about the possible connections between these components and whether the connection are positive or negative. • Pair up with a neighbor or two and exchange your ideas. • Be prepared to share your ideas with the class.
As a start, think about whether the connections shown above are positive or negative, and whether the loop structure is a positive or negative feedback loop. Then compare your answers with those of your nearest neighbors and be prepared to share your results with the class.
Add the connections shown above (CE and EA). think about whether the connections shown above are positive or negative, and whether the additional loop structure is a positive or negative feedback loop. Compare your answers with those of your nearest neighbors and be prepared to share your results with the class.
Two feedback loops shown above ABCDA (outside perimeter) ABCEA (right hand loop)
Finally, add the connections (BE and EB) shown above. Think about: • How pressure on policy makers influences the media? + or - • How the media influences pressure on policy makers? + or - • Whether these are positive or negative connections, and whether the additional loop structures are positive or negative feedback loops. • In this diagram how many feedback loops are there? • Compare your answers with those of your nearest neighbors and be prepared to share your results with the class.
Five loops ABCDA (outside perimeter), ABCEA (not shown with loop symbol-- perimeter of right side), ABEA , BCEB , and BEB All are positive in this example.
How would you rate your understanding of creating and using systems diagrams now? Very poor 1 2 3 4 5 Expert What about today’s lesson has been most helpful? What suggestions do you have for improvements in today’s lesson?
Assignment Volcanic eruptions are a good example of a natural climate forcing mechanism. To prepare you for our module capstone project on the possible effects of a modern day catastrophic volcanic eruption, complete Volcanic Eruptions Part A before coming to class on _April 4 2015(the day of unit 6)______
How would a volcanic eruption alter Earth’s mean surface temperature Volcanic eruption ? Earth’s mean surface Temperature Take a minute to jot down your ideas in the space below, compare with your neighbor and revise as appropriate, and then be prepared to share with the class.
How would a volcanic eruption alter Earth’s mean surface temperature Volcanic eruption - Earth’s mean surface Temperature Figure suggests that solar cooling is greater than increased greenhouse trapping.
See 1883 Krakatoa eruption And 1991 Mt Pinatubo Eruption Both indicated by vertical lines
What: Large eruption event Approximately 10 km3 (tephra) 10 Gtonnes magma (~ 5 km3) 20 Mtonnes SO2 (USGS) Eruption: June 12 – 16 , 1991 The abundance of sulfate aerosols created from SO2 and water vapor evolve over time.
Other reading related to System Diagrams • Systems Diagrams: Understanding How Factors Affect One Another. By Ruth hall http://www.mindtools.com/pages/article/newTMC_04.htm • Guidelines for Drawing Causal Loop Diagrams By: Daniel H. Kim The Systems Thinker, Vol 3, No 1, pp5-6 (Feb 1992). http://www.cs.toronto.edu/~sme/SystemsThinking/GuidelinesforDrawingCausalLoopDiagrams.pdf • Folk Tales, Foreign Policy, and the Value of Systems ThinkingBy Karl North | January 30, 2014
In your own words describe the feedback loop a b c d e a. Possible Answer: As Earth’s temperature increases, increased evaporation (not shown) increases atmospheric water vapor. This increases the atmospheric emissivity, resulting in more longwave radiation going downward from Earth’s atmosphere to its surface. This results in increased surface heating and subsequently a higher surface temperature than would be expected without this positive feedback process.
What is the meaning of loop a b c f g d e a ? Possible answer: this captures the idea that as the atmosphere warms it also radiates more energy to the surface. i.e. The downward flux of longwave radiation from the atmosphere to Earth’s surface is proportional to the product of atmospheric emissivity and the fourth power of atmospheric temperature. Loop a b c d e a captures the increase in emissivity Loop a b c f g d e a capture the increase in atmospheric temperature.
High thin cirrus clouds versus Low thick clouds, a short digression. Three regions on Earth: I) clear skies II) low clouds III) high thin clouds Red arrows represent ???? and green represent ????
High thin cirrus clouds versus Low thick clouds, a short digression. Three regions on Earth: I) clear skies II) low clouds III) high thin clouds Red arrows represent solar radiation and green represent terrestrial radiation.
High thin cirrus clouds versus Low thick clouds, a short digression. • Is our reference with no radiative forcing. • Low clouds reflect sunlight but since the clouds are low they radiate longwave radiation nearly as well as the surface, so the radiative forcing is dominated by the increased reflection of sunlight and is negative. • High thin cirrus clouds do reflect some sunlight. Since they are much colder than the surface, their presence drastically decreases the outgoing longwave radiation and hence the radiative forcing is positive. That is, the greenhouse effect of high thin clouds is more important than their reflection of sunlight.