Confidence Intervals: Bootstrap Distribution
STAT 101 Dr. Kari Lock Morgan. Confidence Intervals: Bootstrap Distribution. SECTIONS 3.3, 3.4 Bootstrap distribution (3.3) 95% CI using standard error (3.3) Percentile method (3.4). Confidence Intervals. Sample. Sample. Sample. Sample. Sample. Sample. Confidence Interval.

Confidence Intervals: Bootstrap Distribution
E N D
Presentation Transcript
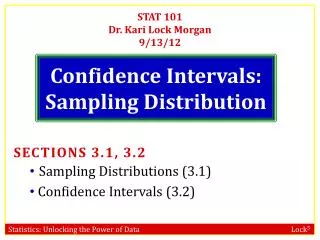
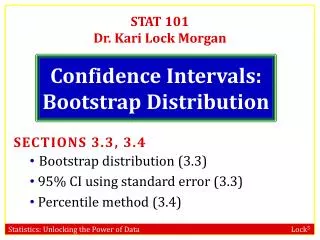
STAT 101 Dr. Kari Lock Morgan Confidence Intervals: Bootstrap Distribution • SECTIONS 3.3, 3.4 • Bootstrap distribution (3.3) • 95% CI using standard error (3.3) • Percentile method (3.4)
Confidence Intervals Sample Sample Sample Sample Sample Sample Confidence Interval statistic ± ME Population . . . Margin of Error (ME) (95% CI: ME = 2×SE) Sampling Distribution Calculate statistic for each sample Standard Error (SE): standard deviation of sampling distribution
Reality • One small problem… • … WE ONLY HAVE ONE SAMPLE!!!! • How do we know how much sample statistics vary, if we only have one sample?!? BOOTSTRAP!
ONE Reese’s Pieces Sample Sample: 52/100 orange Where might the “true” p be?
“Population” • Imagine the “population” is many, many copies of the original sample • (What do you have to assume?)
Reese’s Pieces “Population” Sample repeatedly from this “population”
Sampling with Replacement • To simulate a sampling distribution, we can just take repeated random samples from this “population” made up of many copies of the sample • In practice, we can’t actually make infinite copies of the sample… • … but we can do this by sampling with replacement from the sample we have (each unit can be selected more than once)
Original Sample A simulated “population” to sample from
Bootstrap Sample: Sample with replacement from the original sample, using the same sample size. Original Sample Bootstrap Sample
Reese’s Pieces • How would you take a bootstrap sample from your sample of Reese’s Pieces?
Bootstrap Sample Your original sample has data values 18, 19, 19, 20, 21 Is the following a possible bootstrap sample? • 18, 19, 20, 21, 22 • Yes • No
Bootstrap Sample Your original sample has data values 18, 19, 19, 20, 21 Is the following a possible bootstrap sample? • 18, 19, 20, 21 • Yes • No
Bootstrap Sample Your original sample has data values 18, 19, 19, 20, 21 Is the following a possible bootstrap sample? • 18, 18, 19, 20, 21 • Yes • No
Bootstrap A bootstrap sampleis a random sample taken with replacement from the original sample, of the same size as the original sample A bootstrap statisticis the statistic computed on a bootstrap sample A bootstrap distributionis the distribution of many bootstrap statistics
BootstrapSample Bootstrap Statistic BootstrapSample Bootstrap Statistic Original Sample Bootstrap Distribution . . . . . . Sample Statistic BootstrapSample Bootstrap Statistic
StatKey lock5stat.com/statkey/
Bootstrap Sample You have a sample of size n = 50. You sample with replacement 1000 times to get 1000 bootstrap samples. What is the sample size of each bootstrap sample? 50 1000
Bootstrap Distribution You have a sample of size n = 50. You sample with replacement 1000 times to get 1000 bootstrap samples. How many bootstrap statistics will you have? 50 1000
Why “bootstrap”? “Pull yourself up by your bootstraps” • Lift yourself in the air simply by pulling up on the laces of your boots • Metaphor for accomplishing an “impossible” task without any outside help
Sampling Distribution Population BUT, in practice we don’t see the “tree” or all of the “seeds” – we only have ONE seed µ
Bootstrap Distribution What can we do with just one seed? Bootstrap “Population” Estimate the distribution and variability (SE) of ’s from the bootstraps Grow a NEW tree! µ
Golden Rule of Bootstrapping • Bootstrap statistics are to the original sample statistic • as • the original sample statistic is to the population parameter
Center • The sampling distribution is centered around the population parameter • The bootstrap distribution is centered around the • Luckily, we don’t care about the center… we care about the variability! • population parameter • sample statistic • bootstrap statistic • bootstrap parameter
Standard Error • The variability of the bootstrap statistics is similar to the variability of the sample statistics • The standard error of a statistic can be estimated using the standard deviation of the bootstrap distribution!
Confidence Intervals Bootstrap Sample Bootstrap Sample Bootstrap Sample Bootstrap Sample Bootstrap Sample Confidence Interval statistic ± ME Sample Margin of Error (ME) (95% CI: ME = 2×SE) . . . Bootstrap Distribution Calculate statistic for each bootstrap sample Standard Error (SE): standard deviation of bootstrap distribution
Reese’s Pieces Based on this sample, give a 95% confidence interval for the true proportion of Reese’s Pieces that are orange. (0.47, 0.57) (0.42, 0.62) (0.41, 0.51) (0.36, 0.56) I have no idea 0.52 ± 2 × 0.05
What about Other Parameters? • Estimate the standard error and/or a confidence interval for... • proportion () • difference in means () • difference in proportions () • standard deviation () • correlation () • ... Generate samples with replacement Calculate sample statistic Repeat...
The Magic of Bootstrapping • We can use bootstrapping to assess the uncertainty surrounding ANY sample statistic! • If we have sample data, we can use bootstrapping to create a 95% confidence interval for any parameter! • (well, almost…)
Used Mustangs • What’s the average price of a used Mustang car? • Select a random sample of n = 25 Mustangs from a website (autotrader.com) and record the price (in $1,000’s) for each car.
Sample of Mustangs: Our best estimate for the average price of used Mustangs is $15,980, but how accurate is that estimate? BOOTSTRAP!
Original Sample 1. Bootstrap Sample 2. Calculate mean price of bootstrap sample 3. Repeat many times!
Used Mustangs Standard Error
Used Mustangs • 95% CI: $15,980 ($11,624, $20,336) • We are 95% confident that the average price of a used Mustang on autotrader.com is between $11,624 and $20,336
Global Warming • What percentage of Americans believe in global warming? • A survey on 2,251 randomly selected individuals conducted in October 2010 found that 1328 answered “Yes” to the question • “Is there solid evidence of global warming?” • Give and interpret a 95% CI for the proportion of Americans who believe there is solid evidence of global warming. Source: “Wide Partisan Divide Over Global Warming”, Pew Research Center, 10/27/10. http://pewresearch.org/pubs/1780/poll-global-warming-scientists-energy-policies-offshore-drilling-tea-party
Global Warming Give and interpret a 95% CI for the proportion of Americans who believe there is solid evidence of global warming. www.lock5stat.com/statkey 0.59 2(0.01) = (0.57, 0.61) We are 95% sure that the true percentage of all Americans that believe there is solid evidence of global warming is between 57% and 61%
Global Warming • Does belief in global warming differ by political party? • “Is there solid evidence of global warming?” • The sample proportion answering “yes” was 79% among Democrats and 38% among Republicans. • (exact numbers for each party not given, but assume n=1000 for each group) • Give a 95% CI for the difference in proportions. Source: “Wide Partisan Divide Over Global Warming”, Pew Research Center, 10/27/10. http://pewresearch.org/pubs/1780/poll-global-warming-scientists-energy-policies-offshore-drilling-tea-party
Global Warming 95% CI for the difference in proportions: (0.39, 0.43) (0.37, 0.45) (0.77, 0.81) (0.75, 0.85)
Global Warming • Based on the data just analyzed, can you conclude with 95% certainty that the proportion of people believing in global warming differs by political party? • (a) Yes • (b) No
Body Temperature • What is the average body temperature of humans? www.lock5stat.com/statkey We are 95% sure that the average body temperature for humans is between 98.05 and 98.47 98.6 ??? Shoemaker, What's Normal: Temperature, Gender and Heartrate, Journal of Statistics Education, Vol. 4, No. 2 (1996)
Other Levels of Confidence • What if we want to be more than 95% confident? • How might you produce a 99% confidence interval for the average body temperature?
Percentile Method • For a P% confidence interval, keep the middle P% of bootstrap statistics • For a 99% confidence interval, keep the middle 99%, leaving 0.5% in each tail. • The 99% confidence interval would be • (0.5th percentile, 99.5th percentile) • where the percentiles refer to the bootstrap distribution.
Bootstrap Distribution • For a P% confidence interval:
Body Temperature www.lock5stat.com/statkey We are 99% sure that the average body temperature is between 98.00 and 98.58
Level of Confidence • Which is wider, a 90% confidence interval or a 95% confidence interval? • (a) 90% CI • (b) 95% CI
Mercury and pH in Lakes • For Florida lakes, what is the correlation between average mercury level (ppm) in fish taken from a lake and acidity (pH) of the lake? Give a 90% CI for Lange, Royals, and Connor, Transactions of the American Fisheries Society (1993)
Mercury and pH in Lakes www.lock5stat.com/statkey We are 90% confident that the true correlation between average mercury level and pH of Florida lakes is between -0.702 and -0.433.
Bootstrap CI Option 1: Estimate the standard error of the statistic by computing the standard deviation of the bootstrap distribution, and then generate a 95% confidence interval by Option 2: Generate a P% confidence interval as the range for the middle P% of bootstrap statistics