Download
1 / 2
20 likes | 156 Vues
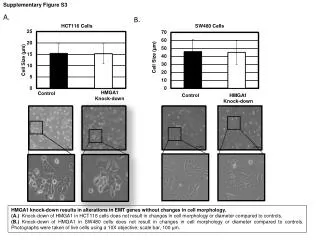
Supplementary Figure S3. A. B. HCT116 Cells. SW480 Cells. Cell Size (µm). Cell Size (µm). HMGA1 Knock-down. Control. Control. HMGA1 Knock-down. 100 µm. 100 µm. 100 µm. 100 µm.

E N D
Supplementary Figure S3 A. B. HCT116 Cells SW480 Cells Cell Size (µm) Cell Size (µm) HMGA1 Knock-down Control Control HMGA1 Knock-down 100 µm 100 µm 100 µm 100 µm HMGA1 knock-down results in alterations in EMT genes without changes in cell morphology. (A.) Knock-down of HMGA1 in HCT116 cells does not result in changes in cell morphology or diameter compared to controls. (B.) Knock-down of HMGA1 in SW480 cells does not result in changes in cell morphology or diameter compared to controls. Photographs were taken of live cells using a 10X objective; scale bar, 100 µm.