
Uploaded by
yepa
1 SLIDES
192 VUES
10LIKES
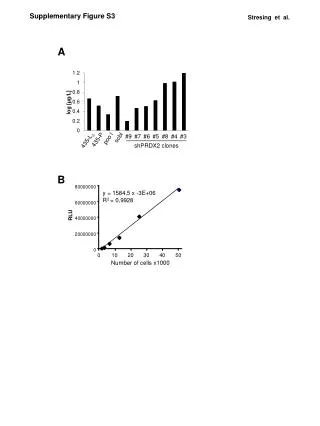
Supplementary Figure S3
DESCRIPTION
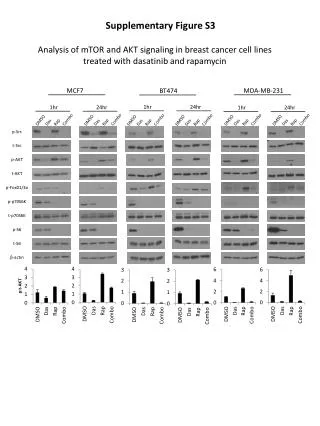
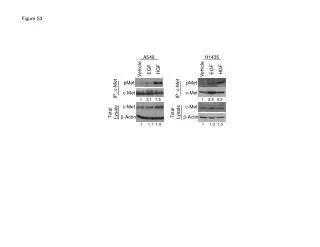
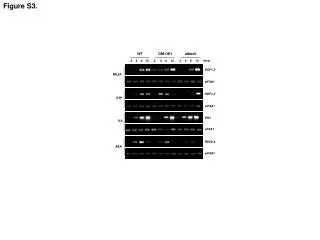
Supplementary Figure S3. Analysis of mTOR and AKT signaling in breast cancer cell lines treated with dasatinib and rapamycin. MCF7. MDA-MB-231. BT474. 1hr. 24hr. 1hr. 24hr. 1hr. 24hr. Combo. Combo. Combo. Combo. Combo. Combo. DMSO. DMSO. DMSO. DMSO. DMSO. DMSO. Rap.
Download
1 / 1
Télécharger la présentation 
Supplementary Figure S3
An Image/Link below is provided (as is) to download presentation
Download Policy: Content on the Website is provided to you AS IS for your information and personal use and may not be sold / licensed / shared on other websites without getting consent from its author.
Content is provided to you AS IS for your information and personal use only.
Download presentation by click this link.
While downloading, if for some reason you are not able to download a presentation, the publisher may have deleted the file from their server.
During download, if you can't get a presentation, the file might be deleted by the publisher.
E N D
Presentation Transcript
Supplementary Figure S3 Analysis of mTOR and AKT signaling in breast cancer cell lines treated with dasatinib and rapamycin MCF7 MDA-MB-231 BT474 1hr 24hr 1hr 24hr 1hr 24hr Combo Combo Combo Combo Combo Combo DMSO DMSO DMSO DMSO DMSO DMSO Rap Rap Rap Rap Rap Rap Das Das Das Das Das Das p-Src t-Src p-AKT t-AKT p-Fox01/3a p-p70S6K t-p70S6K p-S6 t-S6 β-actin


More Related