Download
1 / 40
400 likes | 565 Vues
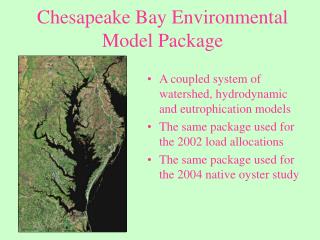
Chesapeake Bay Environmental Model Package. A coupled system of watershed, hydrodynamic and eutrophication models The same package used for the 2002 load allocations The same package used for the 2004 native oyster study. Regional Atmospheric Deposition Model. Watershed Model.

E N D
Chesapeake Bay Environmental Model Package • A coupled system of watershed, hydrodynamic and eutrophication models • The same package used for the 2002 load allocations • The same package used for the 2004 native oyster study
Regional Atmospheric Deposition Model Watershed Model Hydrodynamic Model Eutrophication Model SAV Component Benthos Component The CBEMP circa 1999
Particulate Organic Matter respiration filtration Dissolved Nutrients Dissolved Oxygen excretion settling Water Column Filter Feeders Sediments sediment-water exchange sediment-oxygen demand biodeposits Particulate Organic Matter Dissolved Nutrients diagenesis excretion Oxygen Demand diagenesis feeding Deposit Feeders respiration Diagenesis Model with Benthos
Key Assumptions and Properties • The model is run for 10 years, 1985-1994, on a grid of 3000 surface elements (~4 km2) using time steps of 15 minutes • Oysters are restricted to their historical spatial distribution • The model is parameterized for Chesapeake Bay native oysters
Key Assumptions and Properties • A spatially-uniform mortality rate is specified that combines effects of predation, disease, and harvest • Oyster biomass is dynamically computed based on local conditions including food availability, salinity, dissolved oxygen, and suspended solids
Fundamental Equation FF = filter feeder biomass (mg C m-2) α = assimilation efficiency (0 < α < 1) Fr = filtration rate (m3 mg-1 filter feeder carbon d-1) POC = particulate organic carbon in overlying water (mg m-3) r = specific respiration rate (d-1) β = predation rate (m2 mg-1 filter feeder C d-1) hmr = mortality rate due to hypoxia (d-1) t = time (d)
Modeled Effect of Solids on Filtration From Jordan Model
Conclusions • Our results are consistent with alternate investigations including Officer et al. 1982, Gerritsen et al. 1994, and Newell&Koch 2004. • The greatest ecosystem service of feasible oyster restoration appears to be SAV restoration. • Other ecosystem services provided by oysters include nitrogen removal and dissolved oxygen enhancement.
Conclusions • Oysters have larger impact on their local environment than system-wide • We recommend restoration target specific areas with suitable environments. Look for improvements on similar scales.
Criteria for benthic control of phytoplankton (Officer et al. 1982) • Shallow water depths (2 to 10m) • A large and widespread population as opposed to more localized regions • Partially-enclosed regions with poor hydrodynamic exchange with adjacent water bodies
Suspension-feeding bivalve model … applied to Chesapeake Bay (Gerritsen et al. 1994) • Existing bivalves consume more than 50% of primary production in shallow freshwater and oligohaline reaches • In deep mesohaline portions, bivalves consume only 10% of primary production • Use of bivalves to improve water quality of large estuaries will be limited by the depth and width of the estuary
Modeling seagrass density in response to … bivalve filtration (Newell & Koch) • The presence of modest levels of oysters (< 12 g C/sq m) reduced suspended sediment concentrations by an order of magnitude