Chesapeake Bay Watershed Model Overview
330 likes | 586 Vues
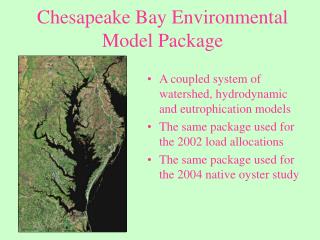
Chesapeake Bay Watershed Model Overview. Jing Wu CBPO Modeling Group. February 4, 2010. Watershed Model Overview. Overview of HSPF model Features of Phase 5 model Uses for management. Chesapeake Bay Program Decision Support System. Land Use Change Model. Criteria Assessment

Chesapeake Bay Watershed Model Overview
E N D
Presentation Transcript
Chesapeake Bay Watershed Model Overview Jing Wu CBPO Modeling Group February 4, 2010
Watershed Model Overview • Overview of HSPF model • Features of Phase 5 model • Uses for management
Chesapeake Bay ProgramDecision Support System Land Use Change Model Criteria Assessment Procedures Bay Model Watershed Model Management Actions COAST Airshed Model Sparrow Effects Allocations
Watershed Model Description • HSPF (Hydrological Simulation Program –Fortran) • Open source, free • Supported by USGS and EPA • Heavily parameterized (sensitive to many inputs) • Recommended for TMDLs
Hourly Values: Rainfall Snowfall Temperature Evapotranspiration Wind Solar Radiation Dewpoint Cloud Cover Annual or Monthly: Land Use Acreage BMPs Fertilizer Manure Atmospheric Deposition Point Sources Septic Loads HSPF Modeling Process HSPF Daily outputs compared To observations
High Density Pervious Urban High Density Impervious Urban Low Density Pervious Urban Low Density Impervious Urban Construction Extractive Wooded Disturbed Forest Corn/Soy/Wheat rotation (high till) Corn/Soy/Wheat rotation (low till) Other Crops Alfalfa Nursery Pasture Degraded Riparian Pasture Animal Feeding Operations Fertilized Hay Unfertilized Hay Nutrient management versions of the above Each segment consists of separately-modeled land uses Plus Point Source and Septic Each calibrated to nutrient and Sediment targets 6
Surface Interflow Lower Zone Ground Water Each Land Use type is divided into four soil Layers Water, Sediment, Nitrogen, Phosphorus 7
Export Export Export Export Export Export Export Each submodel has a complex hydrologic or nutrient cycling structure Trees Denitrification Roots Leaves Nitrate Atmospheric Deposition Particulate Particulate Solution Labile Refractory Ammonia Organic N Organic N Solution Solution Adsorbed Labile Refractory 8 Ammonia Organic N Organic N
Hourly Values: Rainfall Snowfall Temperature Evapotranspiration Wind Solar Radiation Dewpoint Cloud Cover Annual or Monthly: Land Use Acreage BMPs Fertilizer Manure Atmospheric Deposition Point Sources Septic Loads Watershed Model Calibration HSPF Daily outputs compared To observations
Hourly Values: Rainfall Snowfall Temperature Evapotranspiration Wind Solar Radiation Dewpoint Cloud Cover Snapshot: Land Use Acreage BMPs Fertilizer Manure Atmospheric Deposition Point Sources Septic Loads Watershed Model Scenarios Hourly output is summed over 10 years of hydrology to compare against other management scenarios 1991-2000 HSPF “Average Annual Flow-Adjusted Loads” 10
Watershed Model History Management questions and model have been both increasing exponentially in complexity. 11
Phase 5 Model Development Phase 4 Phase 5 12
Co-Developers of Phase 5 Model MDE VA DCR Chesapeake Bay Program Developers EPA UMCES USGS NRCS CRC VPISU $ ICPRB $ $ Advisors and data suppliers NY, PA, MD, DE, VA, WV, DC STAC USGS
Major Advances in Phase 5 • Finer segmentation • Flexible functionality • Transferability • High resolution input data • Automated calibration
Finer Segmentation Phase 5 – A Ten Fold Increase in Segmentation Over Previous Phase 4.3 Model Phase 4.3 land and river segments Phase 5 land segments Phase 5 river segments
Flexible Functionality • Normal HSPF editing modes • hand-edited ASCII files • windows-based point-and-click database • GIS-based population • CBP phase 5 software • Automated file creation and modification in a linux scripting environment
Flexible Functionality WDM = HSPF-specific binary file type UCI = User Controlled Input (input file) MET WDM ATDEP WDM PS WDM Land Input File Generator River Input File Generator 4 1 External Transfer Module 2 3 5 Land variable WDM River variable WDM Final Text Output 6 • Land UCIs are generated • HPSF is run on the land UCIs and output is stored in individual WDMs • The ETM is run converting land output to river input, incorporating land use, BMPs, and land-to-water delivery factors. Output is stored in river-formatted WDMs • River UCIs are generated • HSPF is run on the river UCIs and output is written back to WDMs • Postprocessor reads river WDMs and writes ASCII output
Overall Software System Functionality • Advantages of phase 5 model system over • a traditional HSPF application: - Easily allows large-scale parameter adjustments during calibration - Parallel computing operations convenient - Easy to add new land use types - Easily integrated into outside databases for scenarios - Relatively Easy to add new WQ constituents (bacteria)
Precipitation Temperature Evapotranspiration Wind Solar Radiation Dewpoint Cloud Cover Land Use Acreage BMPs Fertilizer Manure Atmospheric Deposition Point Sources Septic Loads Better, extended, and finer scale data sets Improved Input Data Simulation period is 1984-2005: Two decades of meteorology and watershed management data 19
Scenario Builder Snapshot: Land Use Acreage BMPs Fertilizer Manure Atmospheric Deposition Point Sources Septic Loads 20 20
Inputs BMP implementation Remote Sensing Crop acreage Crop yield Animal numbers Outputs BMP implementation on phase 5 scale Land use Crop Uptake Fertilizer Manure Sample Input and Output Parameters • BMP effects on land use • Tillage Type • Plant and harvest dates • Nutrient application by crop type • Animal manure nutrient content
Automated Calibration • Ensures even treatment across jurisdictions • Fully documented calibration strategy • Repeatable • Makes Calibration Feasible • Enables uncertainty analysis 22
RiverReach Where do we calibrate? Reasonable values of sediment, nitrogen, and phosphorus Observations of flow, sediment, nitrogen, and phosphorus
Phase 5 River Segments and Calibration Stations Flow: 292 Water Quality: 130
Calibration Strategy • Match observations in rivers • Match properties and trends • Groundwater recession curve • Crop uptake of Nitrogen • Match literature and other models • Reasonable rates of nutrient export • USGS estimator and sparrow empirical models 25
Calibration Process Single-processor time Hydrology Land parameters River data 1 week Temperature Land parameters River parameters River data Land Sediment Land parameters Land targets 1 week Land Nutrients Land parameters Land targets 1 week River Water Quality River parameters River targets 2 weeks 26
Open-Source Model Transferability • Entire model available on web • Input data • Modified HSPF • Phase 5 system • Already in Use • Community model in Climate Change Study • Community model at ICPRB • Phase 5 output in Potomac PCB TMDL • Phase 5 information in MDE TMDLs • Phase 5 information in USGS Watershed Study • USGS Shenandoah Models • Phase 5 output in Academic studies • UNC / Baltimore LTER study
WSM Uses:Divide Load into contributing areas and sources Ultimate Source Land Use Source
WSM Uses:Track Implementation Progress from different sources over time Agriculture
Nitrogen Loads Delivered to the Chesapeake Bay By Jurisdiction Point source loads reflect measured discharges while nonpoint source loads are based on an average-hydrology year 333.9 289.9 281.1 277.7 275.1 270.2 266.3 262.9 261.9 260.7 184.4 183.1 175 30
WSM Uses:Determine Effective Practices From the Chesapeake Bay Commission Report: Cost-Effective Strategies for the Bay December, 2004
WSM Uses:Estimate annual loads below monitoring stations Roughly 25% of the total load is unmonitored
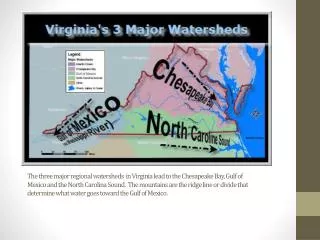
WSM Uses:Allocating Nitrogen-Phosphorus-Sediment loads ...then by 20 major tributary basins by jurisdiction …then by 44 state-defined tributary strategy subbasins By 9 major river basins Watershed States Responsibility Watershed States Responsibility Watershed Partners Responsibility