Download

1 / 30
300 likes | 557 Vues
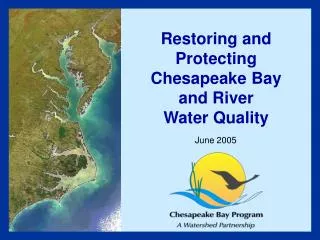
Chesapeake Bay TMDL Primer: Chesapeake Bay Watershed and Bay Water Quality Models. The Economics of Water Quality Improvements in Chesapeake Bay Workshop October 31 and November 1, 2011. Rich Batiuk, Associate Director for Science Chesapeake Bay Program Office

E N D
Chesapeake Bay TMDL Primer: Chesapeake Bay Watershed and Bay Water Quality Models The Economics of Water Quality Improvements in Chesapeake Bay Workshop October 31 and November 1, 2011 Rich Batiuk, Associate Director for Science Chesapeake Bay Program Office U.S. Environmental Protection Agency Region 3
Chesapeake Bay Scenario Builder Chesapeake Bay Airshed Model Chesapeake Bay Land Change Model Chesapeake Bay Water Quality and Sediment Transport Model Chesapeake Bay Filter Feeder Model Chesapeake Bay Watershed Model
For Our Beloved Economists… • Access to suite of state of science, fully independent scientifically peer reviewed, fully documented models and tools available NO WHERE else for a single great waterbody • Access to two+ decades of input data and model scenario outputs • Model outputs stated in management applicable terms—pounds of pollution delivered to impaired waters, percentage of water quality standards attainment, etc.
For Our Beloved Economists… • Access to decision making processes developed and blessed by the partnership1 • Water criteria attainment assessment • Load allocations to major river basin by jurisdiction • 3 year critical period, etc. • Where applicable, computer programming available to apply the agreed to decision making process • All decision making processes fully documented within the Bay TMDL document 1. Ok, so NY told us otherwise on the allocation methodology….
Farmland and Forest Land Loss (2000 to 2030) Source: Chesapeake Bay Land Change Model Version 3
For Our Beloved Economists • Extent of development by county and modeling segment • Fraction of development impacting farmland and forest lands • Fraction of future population on sewer and septic systems • Changes in land uses for input into watershed model
For Our Beloved Economists… • Access to the full suite of data, inputs, conservation practices, BMPs,….ok go back to the previous slide and pick your favorite data, application rate, and its yours!
Phase 5 Chesapeake Bay Watershed Model Phase 5 Segmentation Phase 5 Calibration Sites Calibration sites = 296 Land Segments = 308 River Segments= 1,063 Land uses = 25 Simulation Years = 21 (’85-’05) 14
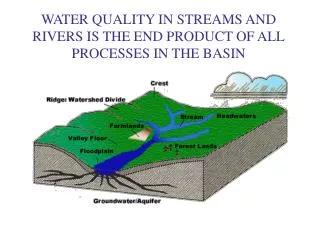
How the Watershed Model Works Hourly or daily values of Meteorological factors: Precipitation Temperature Evapotranspiration Wind Solar Radiation Dew point Cloud Cover Annual, monthly, or daily values of anthropogenic factors: Land Use Acreage BMPs Fertilizer Manure Tillage Crop types Atmospheric deposition Waste water treatment Septic loads Daily flow, nitrogen, phosphorus, and sediment compared to observations over 21 years HSPF
Each segment consists of 25 separately-modeled land uses: Developed High Density Pervious Urban High Density Impervious Urban Low Density Pervious Urban Low Density Impervious Urban Construction Extractive Combined Sewer System Natural Wooded / Open Disturbed Forest Agriculture Corn/Soy/Wheat rotation Other Row Crops Hay Alfalfa Pasture Livestock production Nursery Plus specialized versions of the above for a total of 15 agricultural land uses How the Watershed Model Works Plus: Point Source and Septic Loads, and Atmospheric Deposition Loads 16
How the Watershed Model Works Fertilizer Manure Atmospheric deposition Precipitation } Management filter Runoff Hydrology submodel Sediment submodel River Phosphorus submodel hourly Nitrogen submodel
For Our Beloved Economists… • Access to the nitrogen, phosphorus, and sediment loads • End of stream • Delivered to the Bay • Yield (pounds/area) • Model segment, county, major river basin, jurisdiction and basinwide scales • BMPs—acreages, linear feet, animal units • Practice efficiency/effectiveness measures
Bay Water Quality Model • 57,000 cells • Predicts changes in water quality due to changes in nitrogen, phosphorus, and sediment loads • Dissolved Oxygen • Water clarity • Chlorophyll a • Also simulates algae, underwater Bay grasses, bottom dwelling worms and clams, • Linked with filter feeders (oysters, menhaden) model Developed by scientists at the US Army Corps of Engineers, University of Maryland, Virginia Institute of Marine Science, HydroQual, Versar, and Rutgers University
Minimum Amount of Oxygen (mg/L) Needed to Survive by Species Bay Dissolved Oxygen Criteria Migratory Fish Spawning & Nursery Areas 6 Striped Bass: 5-6 American Shad: 5 Shallow and Open Water Areas 5 White Perch: 5 4 Yellow Perch: 5 Hard Clams: 5 Deep Water Alewife: 3.6 3 Bay Anchovy: 3 Crabs: 3 2 Deep Channel 1 Spot: 2 Worms: 1 0
For Our Beloved Economists… • Model simulated water quality standards attainment values for each unique designated use segment • Dissolved oxygen • SAV acreage • Water clarity • Chlorophyll a (tidal James, DC waters only) • Estimates of pollutant load reductions on ecosystem processes e.g., filter feeding • Relationships between pounds reduced and water quality standards attainment
Allocations Based on Relative Effect of a Pound of Pollution on Bay WQ
For Our Beloved Economists… • Access to ‘water quality impact per pound of pollution’ information for any location within the watershed and any of the 92 tidal Bay segments • Tool that illustrates ‘relative effect’ of each basin on each of the 92 segments • Essentially provides a common currency—relative effect on dissolved oxygen per pound of pollutant reduced across the entire watershed
Developing a Bay Pollution Diet in Six Easy Steps Step 1: Quantify per pound impact on Bay water quality. Step 4: Jurisdictions further allocate to 92 segment watersheds. Step 5: Jurisdictions allocate to sources. Step 2: Array major river basins by jurisdiction by their relative impact on Bay water quality. Step 3. Determine allocation for the major river basins and jurisdictions by applying the agreed to allocation methodology.
Developing a Bay Pollution Diet in Six Easy Steps Step 1: Quantify per pound impact on Bay water quality. Step 4: Jurisdictions further allocate to 92 segment watersheds. Step 5: Jurisdictions allocate to sources. Step 6. EPA based the TMDL allocations on jurisdictions’ WIPs, with adjustments as needed for reasonable assurance. Step 2: Array major river basins by jurisdiction by their relative impact on Bay water quality. Step 3. Determine allocation for the major river basins and jurisdictions by applying the agreed to allocation methodology.
For Our Beloved Economists… • Access to a comprehensive load allocation methodology that formed the basis for the December 2010 Bay TMDL • Incorporation of ‘reasonable assurance’ into the final allocations, again, following a documented evaluation process • Allocation process is completely scalable….can be applied at the basinwide down to the county or small watershed scales
Rich Batiuk Associate Director for Science U.S. Environmental Protection Agency Chesapeake Bay Program Office 410-267-5731 batiuk.richard@epa.gov www.chesapeakebay.net