Download

1 / 18
290 likes | 657 Vues
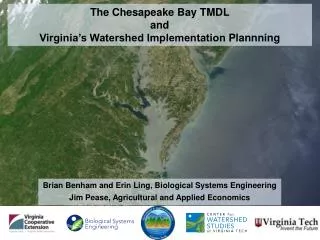
The Chesapeake Bay and its Watershed. An Introduction to an Estuary in Danger. CB Watershed Facts. 64,000 square miles with 16 million people New York, West Virginia, Pennsylvania, Maryland, Virginia, Delaware Major rivers include Susquehanna, Potomac, Rappahannock, James, York. Salinity

E N D
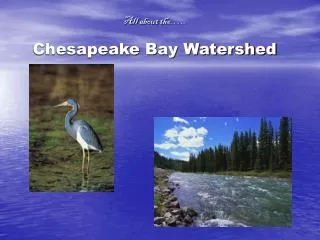
The Chesapeake Bay and its Watershed An Introduction to an Estuary in Danger
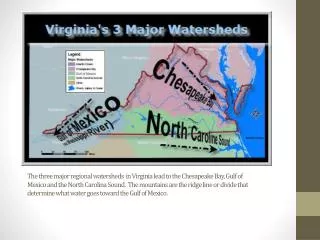
CB Watershed Facts • 64,000 square miles with 16 million people • New York, West Virginia, Pennsylvania, Maryland, Virginia, Delaware • Major rivers include Susquehanna, Potomac, Rappahannock, James, York
Salinity Zones • Freshwater • 1 -10 ppt • 10-18 ppt • 18-30 ppt
Nutrient Inputs Algae Bloom Die Off Reduced Light Die Off of SAV Decay Low Oxygen
Indicators of the Health of the Chesapeake Bay Plus nitrogen/phosphorus, crabs, and rockfish
Indicators - Toxics reduction • billions of pounds released into air and water • polluted “hot spots” - Elizabeth, Anacostia, Patapsco Rivers • Goal: reduce by 50%
Indicators - Dissolved oxygen • DO - free oxygen in water • photosynthesis and air-water interaction • essential for respiration of aquatic animals • 5ppm- min. healthy level
Indicators - water clarity • turbidity • sediment and algae cloud the water and block sunlight • Goal: secchi depth average 6 feet
Indicators - Resource lands • forests and well managed farms are least polluting land uses • provide habitat and filtering • Goal: reduce loss by 25% per year to 67,500 acres annually
Indicators - Forested Buffers • wildlife habitat, recharge groundwater, moderate temperatures, control storm water, reduce erosion • Goal: increase by 1500 miles of shore line
Indicators - Wetlands • control erosion and flooding; act as filters • food and habitat for 2/3 species harvested commercially • Goal: increase by 125,000 acres in watershed
Indicators - Underwater Grasses • SAV - Submerged aquatic vegetation • serves as habitat and food • Goal: 225,000 acres
Indicators - oyster abundance • economic base, habitat, filters • problems: overharvesting, disease, pollution • Goal: 8% of 1870 levels
Indicators - migratory fish shad & herring - anadromous - migrate from ocean to freshwater to spawn eels - catadromous - migrate from freshwater to ocean to spawn Goal:1500 miles reopened (Embrey Dam opened in 2004)
Additional Concerns • Crabbing industry • Sport fishing - rockfish • Menhaden decline • Economic health of watermen • Invasive/introduced species- phragmites, Japanese oysters