Download

1 / 26
260 likes | 286 Vues
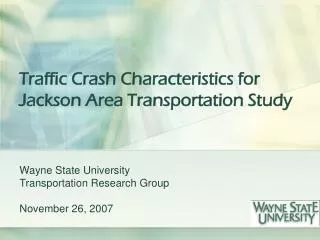
Traffic Crash Characteristics for Jackson Area Transportation Study. Wayne State University Transportation Research Group November 26, 2007. Map of MPO Boundaries. Jackson. Jackson County Crash Trends. Total, Injury, and Fatal Crash Trends – Jackson County (1998-2006).

E N D
Traffic Crash Characteristics for Jackson Area Transportation Study Wayne State University Transportation Research Group November 26, 2007
Map of MPO Boundaries Jackson
Total, Injury, and Fatal Crash Trends – Jackson County (1998-2006)
AIRPORT RD @ COUNTY FARM RD AIRPORT RD @ O NEILL DR AIRPORT RD @ SCHEELE DR AIRPORT RD @ W ARGYLE ST AIRPORT RD @ WAYLAND DR ANDREW AVE @ CLINTON RD COOPER RD @ W PARNALL RD E MICHIGAN AVE @ S DETTMAN RD E MICHIGAN AVE @ S GORHAM ST E MICHIGAN AVE @ S MECHANIC ST E WASHINGTON AVE @ FRANCIS ST E WASHINGTON AVE @ S MECHANIC ST LANSING AVE @ W PARNALL RD LAURENCE AVE @ WILDWOOD AVE N BLACKSTONE ST @ W LOUIS GLICK HW N BROWN ST @ W MICHIGAN AVE N WEST AVE @ S WEST AVE N WEST AVE @ W ARGYLE ST N WEST AVE @ W GANSON ST N WEST AVE @ W MONROE ST N WEST AVE @ W NORTH ST N WEST AVE @ WILDWOOD AVE N WISNER ST @ W ARGYLE ST N WISNER ST @ W GANSON ST N WISNER ST @ WILDWOOD AVE REYNOLDS RD @ SPRING ARBOR RD ROBINSON RD @ W MICHIGAN AVE S BROWN ST @ SPRING ARBOR RD S JACKSON ST @ W WASHINGTON AVE S WEST AVE @ W WASHINGTON AVE Intersection Hot Spots (2004-2006 data)
Project Objectives • Determine crash trends and characteristics for Jackson County • Select 30 high-crash locations for detailed analyses MPO will ultimately select • Collect and analyze crash data (UD-10 forms) • Crash types • Specific location of crash • Probable causes of crashes • Collect and analyze traffic operational data • Recommend site-specific countermeasures
Field Data Collection • For the 30 study intersections: • Peak period traffic counts • Speed studies • Existing condition survey • Traffic control devices • Driveways • Lane assignments • Preparation of site diagrams • Photographs of all sites
Crash Analysis • Pattern analysis • Day vs. Night • Various weather conditions • Peak vs. Off-peak • Crash types (rear end, angle, left-turn head-on, etc.) • Special circumstances (unbelted, alcohol, speeding & red light running, etc.) • Crash causation analysis • Countermeasures suggested for “correctable” crashes
Traffic Operations and Safety Analysis • For each intersection: • Traffic flow analysis • Peak flow diagrams • Speed data analysis • Capacity analysis • Evaluation of Level of Service (LOS) • Safety deficiency analysis • Geometric • Traffic control • Environmental • Corridor analysis
Countermeasures • Engineering • Signal timing plans • Signal equipment improvements • Policy-Related • Enforcement • Education • Behavioral-Related • Targeted enforcement to improve driver behavior
Temporal Crash Trends (1997-2004) Total Crash Frequency Total Crash Frequency Month Day Total Crash Frequency Time
W. Michigan Ave. and N. Westnedge Ave. Existing Condition Diagram
W. Michigan Ave. and N. Westnedge Ave. 2003 Collision Diagram 2004 Collision Diagram
W. Michigan Ave. and N. Westnedge Ave. 2005 Collision Diagram
W. Michigan Ave. and N. Westnedge Ave. Proposed Diagram List of Recommendations: • Provide adequate clearance intervals • Install mast-arm traffic signals • Relocate stop bars • Post speed limit signs downstream of the intersection • Upgrade lane markings • Provide stop signs for driveways • Implement optimized PM signal timing