Download
1 / 20
200 likes | 298 Vues
Explore the anatomy of an earthquake, types of shockwaves, Richter Scale, and how to locate earthquake epicentres using seismographic charts in this informative tutorial. Learn about P-waves, S-waves, L-waves, and seismograph animations. ###

E N D
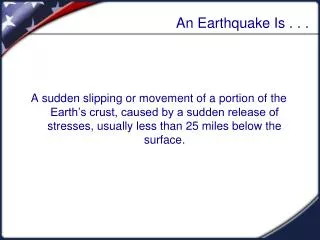
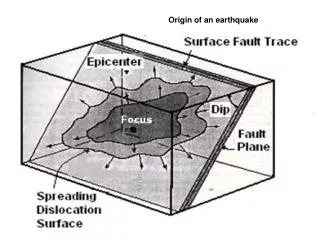
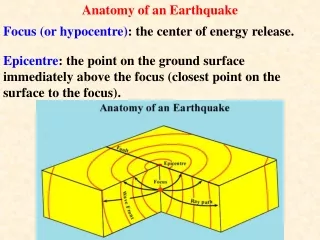
Anatomy of an Earthquake Focus (or hypocentre): the center of energy release. Epicentre: the point on the ground surface immediately above the focus (closest point on the surface to the focus).
Types of Shockwaves P-waves (primary waves) Compress and relax rock through which they pass. Pass through liquids and solids. Highest velocity seismic waves.
S-waves (secondary or shear waves) Cause side to side motion of rocks through which they pass. Velocity slower than P-waves. Travel through solids, not fluids.
L-waves (surface waves) Travel along the surface like a water surface wave. Slowest waves but most destructive. Height up to > 0.5 m. Length up to > 8m. Last for 3 to 4 minutes. Due to the combination of P-waves and S-waves at the surface.
Seismographs record the passage of seismic waves on a seismogram: Recording pen is on a free swinging weight that remains stationary as the recording chart moves in response to the shock waves. Seismometers are mounted on bedrock as P and S waves are damped by soil, etc.
Seismograph Animation Example of a Seismogram
Richter Scale: a measure of the “magnitude” of an earthquake. Based on the amplitude of seismic waves measured on a seismograph, corrected for distance from the epicentre. Proportional to the amount of energy released at the focus. Value does not vary with distance from epicentre. Logarithmic: a 1 unit increase in the scale represents an increase in energy release by a factor of 31.
Magnitude Approximate Number Approx. energy (Richter Maximum Per Year release (Kg of TNT Scale) Intensity equivalents). 1 2,900,000 20 2 II 360,000 600 3 49,000 20,000 4 III 6,200 600,000 5 VI 800 20,000,000 6 VII 120 600,000,000 7 X 18 20 billion 8 XII 1 60 billion 9 Decades apart 20 trillion
Assignment 3 Tutorial Locating Earthquake Epicentres When an earthquake happens Seismic (shock) waves travel outward from the centre of the site of shock wave generation (the focus of the earthquake). Primary waves (P-waves) travel fastest through the Earth and arrive at any point at the Earth’s surface before the next fastest waves, the secondary waves (S-waves). These shock waves may be detected and measured at the Earth’s surface by using a seismograph. A seismographic chart or seismogram is a record of such waves and it records information that includes: the time of arrival of each wave and the amplitude of the waves. Wave amplitude depends on the magnitude of the earthquake (the amount of energy released).
In this example, an Earthquake took place somewhere in the map area shown below. Seismographs recorded the seismic waves at the three locations shown. Using Seismographic charts you will find the location of the Epicentre of the Earthquake (the point on the land surface immediately above the focus).
The Seismographic Chart, below, shows that at Location 1 the P-waves began to arrive at the location of the seismograph at 13 seconds whereas the S-waves did not arrive until 49 seconds. The distance to the earthquake epicentre determines the difference in time of arrival of the P and S waves. In this case the difference is: S – P = 49 – 13 = 36 seconds.
The amplitude of the S-wave at the site of the seismograph depends on the distance to the focus and the magnitude of the Earthquake (which increases with the amount of energy released to produce the shock waves). In our example, the amplitude of the first S-wave is 11 mm.
The scales, below, can be used to interpret the distance to the Earthquake Epicentre and the magnitude of the Earthquake. From the seismograph chart: Amplitude = 11 mm S – P = 36 seconds Give the graph a few seconds, it’s animated.
The distance to the epicentre can be taken from the scale on the far left on the basis of the difference between the P and S wave arrival times. In this case, to produce a 36 second lag between the arrival of the P and S waves requires a total travel distance of 325 kilometres. Therefore, the Epicentre was 325 kilometres from Location 1.
Because we do not know the direction to the Epicentre from Location 1 we only know that it must fall on the circle centred on Location 1 with a radius equal to 325 km.
If we add similar data from Location 2 (taken from Seismographic charts not included in this tutorial but collected in the manner used for Location 1): S – P = 55 seconds Amplitude = 2.1 mm We find that the distance from Location 2 to the epicentre was 510 km.
When we plot the circle with radius 510 km, centred on Location 2, we find two points of intersection with the circle for Location 1. Either is the potential Epicentre.
Now we’ll add the data for Location 3. S – P = 48 seconds Amplitude = 4 mm We find that the epicentre was located 430 km from Location 3. Note that the magnitude is the same no matter how far from the epicentre the seismograph is.
By drawing the circle with radius 430 km centred on Location 3 we find a unique intersection of all three circles: this intersection is theEpicentre. The procedure followed in this tutorial is exactly the procedure to use for Assignment 3.