Download
1 / 62
630 likes | 850 Vues
Training Course on Renewable Energy Jan 2011 PolyU –EE Dept. Contents. Unit 1: General Concepts (2 hours, am 5/Jan) Unit 2: Wind Energy (4 hours, am 5&8/Jan) Unit 3: Solar Energy (5 hours, am 8 & 12/Jan) Unit 4: Fuel Cells (2.5 hours, am 12&22/Jan)

E N D
Contents • Unit 1: General Concepts (2 hours, am 5/Jan) • Unit 2: Wind Energy (4 hours, am 5&8/Jan) • Unit 3: Solar Energy (5 hours, am 8 & 12/Jan) • Unit 4: Fuel Cells (2.5 hours, am 12&22/Jan) • Unit 5: Geo-energy (2.5 hours, am 22/Jan) • A quiz (15 MCs) at the end of 8/Jan on general concept & wind energy • A quiz (15 MCs) at the end of 12/Jan on solar energy • A quiz (15 MCs) at the end of 22/Jan on fuel cells & geo-energy
Pre-unit reading of Unit 1 • If you like to do some reading before this unit, try: • http://en.wikipedia.org/wiki/Renewable_energy • http://www.aresearchguide.com/ • http://www.towards-sustainability.co.uk
Contents of Unit 1 • Primary energy flow • Definitions of RE • Amount of sun energy on Earth • World Energy Demand • Proved reserve of fossil fuel • Sustainability • Roles of RE, merits and demerits • Resources and installed capacities of REs
Almost all energy on the Earth comes from the Sun (except a small of tidal energy which comes from the gravitational force of the Moon). • Even fossil fuel can be considered as stored solar energy which was stored for millions of years.
Definition of Renewable Energy • US Energy Information Administration (EIA)’s definition: “Energy resources that are naturally replenishing but flow-limited. They are virtually inexhaustiblein duration but limited in the amount of energy that is available per unit of time. Renewable energy resources include: biomass, hydro, geothermal, solar, wind, ocean thermal, wave action, and tidal action.”
Another definition • Texas Renewable Energy Industries Association (TREIA)’s definition of renewable energy has been adopted by the Texas legislature, and is as follows: "Renewable energy: Any energy resource that is naturally regenerated over a short time scale and derived directly from the sun (such as thermal, photochemical, and photoelectric), indirectly from the sun (such as wind, hydropower, and photosynthetic energy stored in biomass), or from other natural movements and mechanisms of the environment (such as geothermal and tidal energy). Renewable energy does not include energy resources derived from fossil fuels, waste products from fossil sources, or waste products from inorganic sources."
One could argue that oil and natural gas are also coming from natural sources, but when we use them they actually get less, they are not replenished by nature or the process is so slow, that humankind will probably not be there when it is done.
Note that these definitions define renewable energy according to its primary source, which contrasts with other definitions which may define, say, any recurring waste stream as renewable. • Webster’s Online Dictionary, for example, defines renewable as “Capable of being replaced by ecological cycles or sound management practices.”
Why definition is important? • It will affect the policy, the directions in which the governments promoting renewable energy. • It will affect the overlapping areas of “energy efficiency” and “renewable energy”. • HK not yet has a clear definition on RE.
Are these renewable energy? • Energy by thermal treatment of biomass, including incineration of Municipal Solid Waste (MSW) • Electricity recovered by hydro turbine generators installed at the downstream of service reservoirs, waste water treatment reservoirs/tanks, building water supply systems/drainage systems, …
Some other “similar” terms • Sustainable Energy (Very similar to RE) • Alternative/alternate Energy (Simply non-conventional. Is nuclear energy an alternate energy!?) • Green/Clean Energy (Low/no emission. Is nuclear energy a clean energy!? Is biomass/bio fuel clean!?)
Amount of solar energy falling on the Earth The Earth average radius of the earth trajectory: 1.496×10¹¹ m • The power emission from the sun is at 1.37 kW/m2 on the surface of the Earth atmosphere, which has the sun as its centre and the average radius of the earth trajectory. • The power hits a circular disc with an area of 1.275 x 10¹⁴ m2 (cross section area of Earth, since average radius of Earth is 6,371 km). • The power emitted to the earth from the sun is thus 1.74 x 10¹⁷ W (174 Petawatt, PW) continuously. The Sun
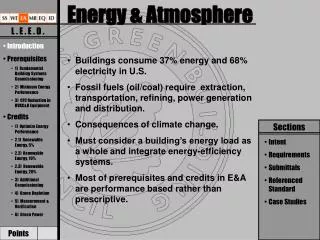
What does it compare ….. • In 2008, total worldwide energy consumption was 474×1018 J per year with 80 to 90 percent derived from the combustion of fossil fuels. This is equivalent to an average power consumption rate of ~15 TW (Terawatts) (1.503×10¹³ W), which is less than 1/10000 of the solar power falling on the atmosphere of the Earth.
However, not all solar fallingon the atmosphere are absorbed by land and oceans, but still a large part
Interesting comparison … • Based on this: the annual world energy consumption is about the average sun energy absorbed by the earth area (land or ocean) of 86,100 sq. km. (a bit less than Portugal) in a year.
Interesting comparison … Roughly assume the conversion efficiency of typical photovoltaic (PV) panel is 10%. A huge PV of 861,000 sq. km. (a bit less than Venezuela) is sufficient for the world power consumption.
World Energy Demand – Long-term Energy Sources (1 barrels of oil equivalent = 6.383 x10⁹ Joule)
Fossil Fuel Proven Reserves of the World in 2009 Source: www.worldcoal.org
Proven coal reserve • At 2008, It has been estimated that there are over 861 billion tonnes of proven coal reserves worldwide. Around 5.8 billion tonnes of hard coal and 953million tonnes of brown coal were usedworldwide in 2008.This means that there is enough coal to last us around 127 years at current consumption rates. (but Since 2000, global coalconsumption has grown faster than any otherfuel – at 4.9% per year). In contrast, proven oil and gas reserves are equivalent to around 35 and 54 years at current production levels.
2008 Proved coal reserves: the top tencountries • Source: 2010 Survey of Energy Resources by World Energy Council
Resource, Reserves and Proved Reserves • Resource: The amount of coal that may be present in a deposit or coalfield. This does not take into account the feasibility of mining the coal economically. Not all resources are recoverable using current technology. • Reserves: Reserves can be defined in terms of proved (or measured) reserves and probable (or indicated) reserves. Probable results have been estimated with a lower degree of confidence than proved reserves. • Proved Reserves: Reserves that are not only considered to be recoverable but can also be recovered economically. This means they take into account what current mining technology can achieve and the economics of recovery. Proved reserves will therefore change according to the price of coal; if the price of coal is low proved reserves will decrease.
Proved reserves of oil • Proved reserves of oilstood at 1 239 billionbarrels (163 billion tonnes) at end-2008, some24 billion barrels (3 billion tonnes) higher than atthe end-2005 level. While the world crude oil consumption is about 35.5 billion barrels per year at 2009. Hence the proven oil reserve is equivalent to about 35 years of current consumption rate. • The Middle East remains the principal location ofoil reserves, with 61% of the global total,followed by Africa with 11%, South America10%, and Europe (including the whole of theRussian Federation) 8%, followed by Asia andNorth America each at around 5%.
Crude oil and natural gas liquids: provedrecoverable reserves at end-2008 • Source: 2010 Survey of Energy Resources by World Energy Council
Proved reserves of natural gas • At the end of 2008, 103 countries were reportedto possess proved reserves of natural gas.Compared with the level reported for end-2005total reserves show an increase of 9.1 trillioncubic metres (tcm) or 5.1%. At the present level of185.5 tcm (or approximately 6 550 tcf), globalgas reserves are equivalent to more than 54years’ production (net of re-injection) at the 2008rate.
2008 Natural gas production (billion cubic meters) • Source: 2010 Survey of Energy Resources by World Energy Council
Sustainability • All fossil fuels will eventually run out and it is essential that we use them as efficiently as possible, and try to find out new energy resource/reserve. • The best is to find something which is renewable (replenished) and clean, to fulfill the concept of sustainability in economic development.
Concept of sustainability in economic development • Those issues related to energy • To ensure to have enough energy reserve to sustain the world at least at more or less the current level of living standard. • To ensure the economic activities (including the production and utilization of energy) should not deteriorate the living environment (global warming, climate change, acid rains, etc.) and hence maintaining the development. • Hence RE has key role in above both issues.
General merits of RE • Repenlish in a short time, cannot be depleted. RE renews itself constantly as part of nature. • Very low operating cost, the “fuel” is basically free (may be except biofuel and some biomass) and the maintenance costs for some of the RE systems (those without much moving parts, say PV, passive solar heating) are low. • Low or no Green House Gas (GHG) emissions (CO2, SOx, NOx, …) . (Note: but one should consider the “life-cycle emission”, not only the emission in the operation phase).
General merits of RE – Cont. • RE resources usually located in rural areas, developments of RE can develop economies of these rural areas. • Development of new industries/services (PV production, wind turbine productions, emission trading, etc.)to enhance economic developments. • Can bring other side benefits, other than generating power (e.g.: hydro => flood management, tidal/wave energy => protection of coastal shores, wind farms => tourism !?, PV panels => additional solar buffers, etc.).
General demerits of RE • Usually very high initial cost • Overall system efficiency is usually not high, in some cases very low (e.g.: ~10% for PV). • Usually long distances between the locations of RE resources and the power load centers (may be urban solar energy systems are the only exceptions), hence the transmission and distribution (T&D) infrastructures are expensive and also higher losses in the T&D infrastructures. • The erections/operations of the conversion devices usually introduce other environmental problems (detailed in another slide) and other issues (such as visual impacts, public acceptance, etc.). • RE technologies are relatively new, hence new learning curves for engineers, as well as financial planners, and other related personnel.
General demerits of RE – cont. • Usually intermittent, highly fluctuate, can not be predicted accurately in long term (tidal energy and geothermal energy are the exceptions), and hence higher spinning reserve is required on the tradition power generation plants. • As electricity cannot be stored easily, the short-term highly fluctuating electrical output from RE resources also need some fast responding generators (say, gas turbine generators) to complement the operation, and gas turbines are more expensive both in capital cost and operating cost. • The intermittent nature of RE also implies a low load factor or utilization factor (usually refers to average output power / rated or peak power of the generator). This increase the initial cost further.
European Super-Grid of RE • An interesting development: The 2 of last 3 problems will be addressed in Europe when the proposed European Super-Grid of RE comes to fruition. The idea is that wind power from Denmark and the UK and from off-shore wind farms and solar power from Spain and elsewhere will all be linked by a giant electricity grid for complement operation. Hydro schemes in Norway will be used to store the power for release when needed. This super-grid is at the start of planning and will cost billions - around £30/$46 billion to create (according to the Financial Times).
Some of the Environmental problems -1 • Projects such as river dams for hydro-power and tidal barriers are mega projects which require monumental amounts of money. Some of the dam projects across the world have involved exploitative deals for local people. Foreign investors have become richer at the expense of people and wildlife. • Very often the water table of surrounding areas is adversely affected. Ground water wells run dry and more people migrate to towns, putting greater strains on the infrastructure. Nigeria's Kefin-Zaki dam project has been cancelled four times, partly because of concerns about the effect upon water supplies to local farmers. Birds and wildlife would have been at risk, too.
Some of the Environmental problems - 2 In China 1.24 million people were forced to move from their homes to make way for the Three Gorges Dam. Although this dam is thought to lessen the likelihood of flooding in the area, there are concern about upstream erosion and downstream silt deposits reducing the stability of the river. Biofuels, grown to replace petrol and for energy generation, can displace food crops which then has a knock on effect on the price of food. It is believed that the amount of food grown worldwide has declined by as much as 30% as biofuel crops have become more prevalent. Biofuel such as palm oil are also replacing invaluable ancient rainforests and wreaking environmental destruction on native peoples and wildlife. In HK, the off-shore wind farm projects of CLP and HEC also generated concerns of influences on the local marine life and the flight paths of migratory birds.
Common classifications of RE resources • Hydropower • Low head, medium head, high head or - large, small, mini, micro power • Solar energy • Photoelectric (Photovoltaic/PV), CSP, Solar thermal • Wind energy • Vertical axis, Horizontal axis or - Large, medium, small power • Ocean • Tidal range, Tidal flow, Wave & ocean currents, Ocean Thermal Energy Conversion (OTEC) • Geo-energy • Geothermal, Shallow ground energy • Bioenergy • Biofuel (Biomass fuel), Biopower (Biomass fueled power gneration system), Bioproduct
Production of Hydropower Hydropower constitutes 21% of the world’s electricity generating capacity (note: not energy consumption) and it is currently the largest ofthe perpetual or so-called RE energyresources (88% of electricity from RE). Hydro contributes to electricitygeneration in 160 countries. Five (China, Canada, Brazil,Russia and the USA) accountfor more than half of global hydropowerproduction.
Resources of Hydropower • The theoretical potential (reserve) of worldwide hydropower is 2,800 GW, about four times greater than the 777 GWe (supplied 3000 TWh to the world in a year) that has been exploited. Yet, the actual amount of electricity that will ever be generated by hydropower will be much lower than the theoretical potential, due to the environmental concerns and economic constraints.
Ten of the largest hydroelectric producers as at 2009 Source: NextBigFuture.com
There are a few large hydroelectric projects in India, Burma, Russia, Brazil, and Venezuela but most are in China.China's hydropower capacity would grow to 284 gigawatts (GW) and pumped storage hydropower capacity to 41 GW by 2015, and to 330 GW and 60 GW, respectively, by 2020.
The Three Gorges Dam Hydroelectric project • The dam body was completed in 2006. The originally planned components of the project were completed on October 30, 2008, when the 26th generator in the shore plant began commercial operation. Each generator is 700 MW. Six additional generators in the underground power plant are not expected to become fully operational until 2011. Coupling the dam's thirty-two main generators with two smaller generators (50 MW each) to power the plant itself, the total electric generating capacity of the dam will eventually reach 22.5 GW. • The project produces electricity, increases the river's shipping capacity, and reduces the potential for floods downstream. From completion through 9/2009 the dam has generated 348.4 TWh (1,254 PJ) of electricity, covering more than one third of its cost.
Wind Power Resource • The map in next slide is a world, year-round average wind speed map. It is derived from 10 years of GEOS-1 satellite data. Satellite data are the only wind data with global extent, but are less accurate because the data are indirect. Roughly 7 m/s and faster are generally considered as economically worth exploiting today (sometimes this even in higher-cost offshore locations, if it is relatively near power load center); those are the orange, pink, and shades of red and brown in the figure. • In many areas, especially on land, the 6 m/s areas are already economically viable, those are the yellows. We see that the largest wind resources are above the oceans and mid-continental plains of each of the major continents. The coastal oceans are of special interest because they have strong winds. The map below is a year-round average. To see monthly fluctuations, click on thishttp://www.ceoe.udel.edu/windpower/ResourceMap/index-global-mov.html
World Wind Atlas: average wind speed in in m/s Source: www.windatlas.dk
Globally, the wind energy resource is very large. In an in-press article, Archer and Jacobson used worldwide weather stations (more accurate than the above GEOS-1 data, but not covering the oceans) and estimate the worldwide land and near-shore wind resource. • Their calculation of total wind resource is 72 TW. This is about seven times the world's electricity demand and about five times the world energy demand. Although the direct solar resource is larger, in the higher speed wind areas the wind resource is at or near economic viability today.