Download
1 / 16
160 likes | 308 Vues
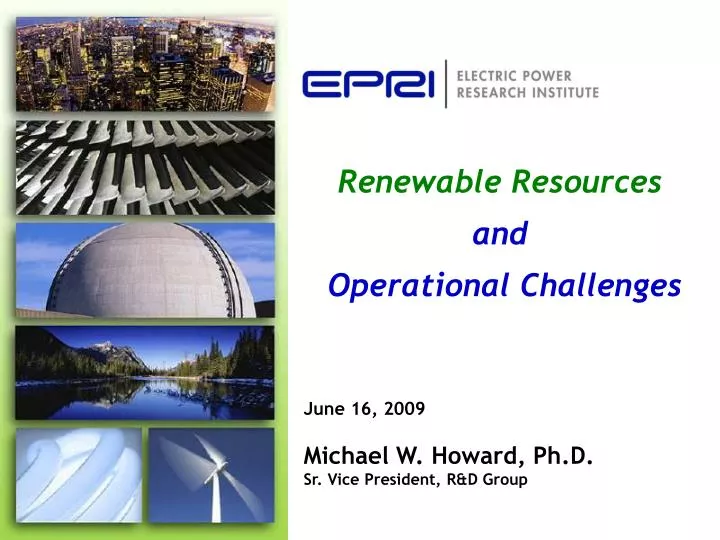
Renewable Resources and Operational Challenges. June 16, 2009 Michael W. Howard, Ph.D. Sr. Vice President, R&D Group. The Electric Power Research Institute. RD&D Consortium for the Electricity Industry. Independent, unbiased, tax-exempt collaborative research organization

E N D
Renewable Resources and Operational Challenges June 16, 2009 Michael W. Howard, Ph.D.Sr. Vice President, R&D Group
The Electric Power Research Institute RD&D Consortium for the Electricity Industry • Independent, unbiased, tax-exempt collaborative research organization • Full spectrum industry coverage • Nuclear • Generation • Environment • Power Delivery & Utilization • 460 participants in over 40 countries • Major offices in Palo Alto, CA; Charlotte, NC and Knoxville, TN
Renewable Technologies Variability and Predictability
Challenge - Balancing Generation and Load Objective Less Variability - More Predictability Load Generation
Wind – Variable and Predictable? Tehachapi Wind Generation
Solar - Variable and Predictable? Minutes Source: Jay Apt CMU, 4.6 MW TEP Solar Array (Arizona) 7
What’s The Solution? • System Visibility • Generation Balancing Resources • Energy Storage • Transmission Integration • Demand Response • Meteorological Prediction
System Visibility Enhanced Grid Visibility 1 4 12 13 750 +282j 440 750 + 262j 6 14 + 200j 250 +84j 5 2 15 7 300 + 100j 176 +88j 8 100 +62j 17 16 130 + 8j 20 + 8j 120 + 11j 9 3 276 + 120j High Speed Scan Rates More Frequent Analysis of System Condition 11 350 + 150j 10 704 + 308j 227 + 420j
Generation Balancing Resource Ramp Rate (MW/min) Time (Hours) Ramp Rate and Duty Cycle for CT Balancing Wind Acknowledgment: Research Conducted by Warren Katzenstein and Jay Apt, CMU
Pump Storage Metal-Air Batteries Flow Batteries Compressed Air Advanced Batteries Lead-Acid and Nickel Cadmium Batteries High Energy Flywheels Ultracapacitors SMES Low Energy Flywheels Energy Storage Hours Discharge Time Minutes Seconds 10s kW 100s kW 100s MW 10s MW Power
Thermal Energy Storage 1 mile
Transmission Integration Requires Transmission to Major Load Centers Wind Resource Map Demand Centers High Wind Availability
Biomass IGCC Wind (32.5% Capacity Factor) NGCC ($6-8/MMBtu) Nuclear PC Comparative Costs of Electricity – 2015 All costs are in December 2007 $ Levelized Cost of Electricity, $/MWh Renewables “out of the money” without incentives or mandates 95% confidence level values based on EPRI Report 1018329 Rev. October 2008 Cost of CO2, $/Metric Ton
Summary - Renewable Resources • 29 States and DC have Renewable Portfolio Standards – 5 States have Renewable Goals • Several renewable generation technologies – viability depends on location and costs • Tradeoff - Variability and Predictability • Several technical solutions exist to integrate renewable resources