Seven New Management and Planning Tools
460 likes | 1.03k Vues
Seven New Management and Planning Tools. Need for New Tools. In 1976, the Union of Japanese Scientists and Engineers (JUSE) saw the need for tools to promote innovation, communicate information and successfully plan major projects. Affinity diagram (or) Affinity Chart (or) K-J method.

Seven New Management and Planning Tools
E N D
Presentation Transcript
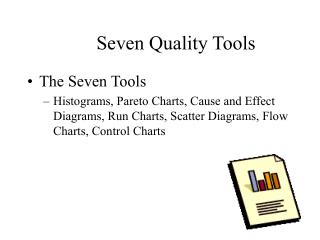
Seven New Management and Planning Tools
Need for New Tools • In 1976, the Union of Japanese Scientists and Engineers (JUSE) saw the need for tools to promote innovation, communicate information and successfully plan major projects
Affinity diagram (or) Affinity Chart (or) K-J method • It was created in the 1960s by Japanese anthropologist Jiro Kawakita. • organizes a large number of ideas into their natural relationships • This method taps a team’s creativity and intuition.
When to Use • When you are confronted with many facts or ideas in apparent chaos • When issues seem too large and complex to grasp • When group consensus is necessary
Typical situations Used • After a brainstorming exercise • When analyzing verbal data, such as survey results
Relations Diagram (or) Interrelationship Diagram(or)Digraph(or) Network Diagram • The relations diagram shows cause-and-effect relationships. • The process of creating a relations diagram helps a group analyze the natural links between different aspects of a complex situation.
When to Use • When trying to understand links between ideas or cause-and-effect relationships, such as when trying to identify an area of greatest impact for improvement. • When a complex issue and Solution is being analyzed & Implemented for causes. • After generating an affinity diagram, cause-and-effect diagram or tree diagram, to more completely explore the relations of ideas.
Example:-A computer support group is planning a major project: replacing the mainframe computer.
Tree Diagram (or) Systematic diagram (or) Tree analysis (or) Analytical tree (or) Hierarchy diagram Description • The tree diagram starts with one item that branches into two or more, each of which branch into two or more, and so on. • It looks like a tree, with trunk and multiple branches.
When to Use • When an issue is known or being addressed in broad generalities. • When developing actions to carry out a solution or other plan. • When analyzing processes in detail. • When probing for the root cause of a problem. • After an affinity diagram or relations diagram has uncovered key issues. • As a communication tool, to explain details to others
Example • The Pearl River, NY School District, a 2001 recipient of the Malcolm Baldrige National Quality Award, uses a tree diagram to communicate how district-wide goals are translated into sub-goals and individual projects
Matrix Diagram (or) Matrix chart Description • The matrix diagram shows the relationship between two, three or four groups of information. It also can give information about the relationship, such as its strength, the roles played by various individuals or measurements
When to Use each Shape An L-shaped matrix relates two groups of items to each other (or one group to itself). • A T-shaped matrix relates three groups of items: groups B and C are each related to A. Groups B and C are not related to each other. • A Y-shaped matrix relates three groups of items. Each group is related to the other two in a circular fashion.
When to Use each Shape A C-shaped matrix relates three groups of items all together simultaneously, in 3-D. An X-shaped matrix relates four groups of items. Each group is related to two others in a circular fashion. A roof-shaped matrix relates one group of items to itself. It is usually used along with an L- or T-shaped matrix.(Used in QFD)
Arrow Diagram (or) Activity Network Diagram (or) Network Diagram, Activity Chart (or) Node Diagram (or) CPM (critical path method) Chart Description • The arrow diagram shows the required order of tasks in a project or process, the best schedule for the entire project, and potential scheduling and resource problems and their solutions.
When to Use • When scheduling and monitoring tasks within a complex project or process with interrelated tasks and resources. • When you know the steps of the project or process, their sequence and how long each task. • When project schedule is critical, with serious consequences for completing the project late or significant advantage to completing the project early.
Process Decision Program Chart(or) PDPC • The process decision program chart systematically identifies what might go wrong in a plan under development. • Countermeasures are developed to prevent or offset those problems. • Using PDPC, you can either revise the plan to avoid the problems or be ready with the best response when a problem occurs.
When to Use • Before implementing a plan, especially when the plan is large and complex. • When the plan must be completed on schedule. • When the price of failure is high.
Example • A medical group is planning to improve the care of patients with chronic illnesses such as diabetes and asthma through a new Chronic illness management program (CIMP). They have defined four main elements and, for each of these elements, key components