Download
1 / 1
10 likes | 124 Vues
This paper explores the tuning process of CLIC accelerating structure prototypes at CERN, addressing the tuning purpose, methodology, results, and implications. It discusses frequency detuning, local reflection correction, and the impact of fabrication errors. The study includes RF measurement results, phase shift errors, and residual reflections, providing insights into improving accelerator performance.

E N D
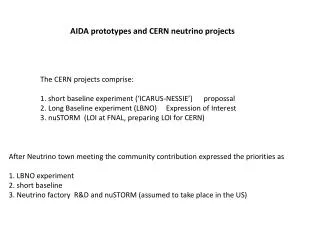
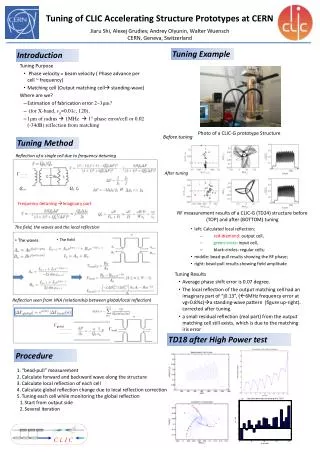
Tuning of CLIC Accelerating Structure Prototypes at CERN Jiaru Shi, Alexej Grudiev, AndreyOlyunin, Walter Wuensch CERN, Geneva, Switzerland Tuning Example Introduction • Tuning Purpose • Phase velocity = beam velocity ( Phase advance per cell ~ frequency) • Matching cell (Output matching cell standing-wave) • Where are we? • Estimation of fabrication error 2~3μm? • (for X-band, vg=0.01c, 120), • 1μm of radius 1MHz 1° phase error/cell or 0.02 (-34dB) reflection from matching Photo of a CLIC-G prototype Structure Before tuning Tuning Method • Reflection of a single cell due to frequency detuning After tuning Γ Q0, f0 Qext if Frequency detuning Imaginary part RF measurement results of a CLIC-G (TD24) structure before (TOP) and after (BOTTOM) tuning • The field, the waves and the local reflection • left: Calculated local reflection; • red-diamond: output cell, • green-cross: input cell, • black-circles: regular cells; • middle: bead-pull results showing the RF phase; • right: bead-pull results showing field amplitude • The waves • The field • Tuning Results • Average phase shift error is 0.07 degree. • The local reflection of the output matching cell had an imaginary part of “j0.13”, (6MHz frequency error at vg=0.8%c)a standing-wave pattern (figure up-right). corrected after tuning. • a small residual reflection (real part) from the output matching cell still exists, which is due to the matching iris error • Reflection seen from VNA (relationship between global/local reflection) Γglobal Γlocal TD18 after High Power test Procedure • “bead-pull” measurement • Calculate forward and backward wave along the structure • Calculate local reflection of each cell • Calculate global reflection change due to local reflection correction • Tuning each cell while monitoring the global reflection • Start from output side • Several iteration