Download
1 / 3
30 likes | 137 Vues
Summary of results for the UBC runs. Step 1) build sequence homology graph Step 2) do clustering on the graph. Clustering output statistics. Distribution of clusters by size (histogram) X-axis denotes cluster size bins (e.g., bin “64”

E N D
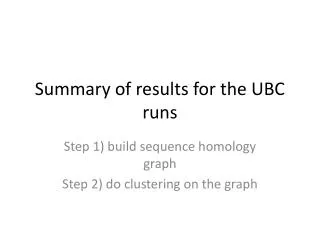
Summary of results for the UBC runs Step 1) build sequence homology graph Step 2) do clustering on the graph
Clustering output statistics Distribution of clusters by size (histogram) X-axis denotes cluster size bins (e.g., bin “64” shows that 22,444 clusters had size between 33 and 64) Y-axis denotes the number of clusters within each bin.
Performance statistics Step 0) preprocessing usingsuffix trees Step 1) building the homology graph Step 2) clustering was performed using Louvian code