Download
1 / 19
190 likes | 327 Vues
Nonlinear Oscillations of Levitated Gas Bubbles and Their Impact on Plasma Formation in Water. Bradley S. Sommers a John E. Foster b. (a) Dept. of Nuclear Engineering, University of Michigan, Ann Arbor, USA, bsso@umich.edu

E N D
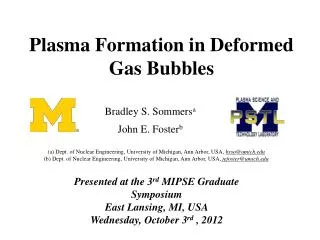
Nonlinear Oscillations of Levitated Gas Bubbles and Their Impact on Plasma Formation in Water Bradley S. Sommersa John E. Fosterb (a) Dept. of Nuclear Engineering, University of Michigan, Ann Arbor, USA,bsso@umich.edu (b) Dept. of Nuclear Engineering, University of Michigan, Ann Arbor, USA, jefoster@umich.edu Presented at the 2nd Graduate Symposium of the Michigan Institute for Plasma Science and Engineering Tuesday, May 21st, 2011
Liquid Plasma: Applications & Issues • Strong chemical reactivity • UV radiation • radicals (OH-, ozone) • energetic electrons • Applications • water purification • industrial processing • Issues • water is a very good insulator • (Eholdoff > 1 MV/cm) • electrode erosion (contamination) • small throughput • shot-to-shot variability 400 μm thin electrode tips small electrode spacing These issues stand as a barrier to practical implementation
Electric Field Effects in Water • Water acts as a “leaky dielectric”2 • dielectric permittivity (bound charge) • finite conductivity (free charge) • Macroscopic effect of electric stress • electric stress: • surface tension stress: • Weber Number: pE bubble interior boundary depressed by pE Ē undisturbed boundary • For 16 kV/cm, 3 mm, WE ~ 1 (applied field) • For 100 kV/cm, 3 mm, WE ~ 25 (streamer) 2Garton, Krasucki, Proc. Royal Soc. Lon.., Vol. 280, No. 1381, July 21, 1964.
A Single Bubble under an A.C. Field • Conditions • voltage: 5kV A.C. • frequency: 600 Hz • electrode gap: 2.3 mm • bubble diameter: 0.64 mm t = 0.0 ms Figure 5. A single oscillation cycle of a levitated bubble being driven by an A.C. electric field.
Observations • dramatic shape change • oscillation frequency ~ 600 Hz • WE ~ 0.17 t = 1.7 ms top electrode E bottom electrode
Lowering the Breakdown Threshold • Bubble shape distortion: increase E/N • Shape effect: The permittivity gradient near the dielectric boundary refocuses and intensifies fields at areas of high curvature. • Volume effect: Under a sufficiently fast expansion of the bubble volume, the internal gas pressure decreases according to an equation of state, (pVγ = constant) field enhanced at dielectric boundary drop curvature can be drastically distorted Conditions for plasma formation inside the bubble can be varied through externally driven distortion 1Azuma, H., J. Fluid Mech., Vol. 393, 1999
Previous Work t = 0.0 ms t = 2.5 ms t = 5.0 ms t = 7.5 ms minimum deformation expansion with streamer maximum deformation • bubble attached to electrode, driven by 5 kV A.C. voltage • bubble oscillates near natural frequency (50 Hz) • streamer excited inside bubble Achieved large bubble deformation, including area increase of up to 20%
Bubble expands in response to the increasing field Deformation closely resembles L =2 mode
At the extremum, bubble curvature becomes sharp, indicating higher order modes. The electric field here is predicted to be intense As the field is reduced, the bubble’s inertia compresses it beyond its equilibrium shape.
Overview • Plasmas are promising for a host of environmental applications but are limited by large voltage and energy requirements. • The reduced field inside a gas bubble submerged in water can be enhanced when it undergoes severe distortions. • shape effect: field intensification near distorted dielectric surface • volume effect: internal pressure drop accompanying expansion • Precise levitation of air bubbles has been achieved via ultrasonic levitation • Intense distortion of suspended air bubbles driven by A.C. fields has been observed with implications for the internal reduced field • severe curvature at bubble “tips” indicates field amplification • substantial volume increases indicate decreases in internal pressure
Experimental ApproachPart I: Ultrasonic Levitation • Purpose: study isolated bubble under repeatable conditions • Physical Mechanism • piezoelectric ceramic transfers electrical energy into acoustic energy • acoustic standing wave established in 3-D rectangular cell • bubble trapped at node • coupler provides lateral stability3 • wave mode: [1,1,2] Figure 1. Water filled bubble levitation chamber 3 Trinh, E.H., Thiessen, D.B., J. Fluid Mech., Vol. 364, 1998
(a) • Piezo specs • operating frequency: 26.4 kHz • Absorbed power: 2.3 Watts • maximum acoustic pressure: ~ 1 atm above ambient (b) Maximum power is absorbed where the piezoelectric impedance is minimized Figure 3. Piezoelectric resonance curves showing the (a) total impedance and (b) absorbed power as a function of frequency
Shape Mode Analysis • Bubble oscillations decompose naturally into spherical harmonics4 • equation of surface: • spherical harmonic coeffcients: • Image Analysis • convert RGB images to binary • apply edge tracing algorithm to obtain bubble surface data • numerially integrate to find mode coefficients original image binary image 4 Trinh, E.H., Thiessen, D.B., J. Fluid Mech., Vol. 364, 1998
baseline volume increases over several cycles approximate applied voltage signal overlayed equilibrium area line Figure 6. Percentage increase in cross sectional area of oscillating bubble as measured from image analysis. Volume expands under the action of the applied electric field.
Experimental ApproachPart II: Bubble Deformation • Purpose: measure shape distortion from an applied electric field • Setup • bubble injection via syringe • degassed, deionized water • (κ = 10 μS/m) • A.C. voltage: 5 kV • frequency: 100-1000 Hz • Diagnostics • fast camera: 5000 frames per second • Pearson coil / H.V. probe • hydrophone Translatable electrodes Figure 2. Photo of electrodes submerged in bubble levitation chamber
Figure 4. Full setup used to drive and document suspended bubble oscillations
Dominant Mode: L = 2 • previously observed under under uniform D.C. field5 • behaves like an ellipse to 1st order • Higher order modes • at extreme deformation, bubble tips display sharp curvature • Indicates the presence of higher order modes (a) A2 = 0.0 (b) A2 = 0.3 (c) A2 = 0.6 sharp curvature indicates higher order modes 5Grigor, Zharov, Tech. Phys., Vol. 44, No. 8, 1999
Higher order modes are not observed L = 2 mode is observed to be dominant Figure 7. Spherical harmonic mode decomposition of oscillating bubble. Modes L = 2 - 6 shown.
Acknowledgments I would like to thank the National Science Foundation (NSF, grant # 1033141), particularly the CBET for supporting this research. I would also like to thank my advisor John Foster. For further information Please contact bsso@umich.edu. More information can be found at the Plasma Science and Technology Lab’s website, http://www-ners.engin.umich.edu/lab/pstlab/