Download
1 / 27
270 likes | 404 Vues
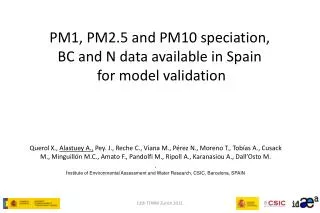
xavier.querol@idaea.csic.es. PM1, PM2.5 and PM10 speciation, BC and N data available in Spain for model validation. Querol X., Alastuey A., Pey. J., Reche C., Viana M., Pérez N., Moreno T., Tobías A., Cusack M., Minguillón M.C., Amato F., Pandolfi M., Ripoll A., Karanasiou A., Dall’Osto M. .

E N D
xavier.querol@idaea.csic.es PM1, PM2.5 and PM10 speciation,BC and N data available in Spain for model validation QuerolX., Alastuey A., Pey. J., Reche C., Viana M., Pérez N., Moreno T., Tobías A., Cusack M., Minguillón M.C., Amato F., Pandolfi M., Ripoll A., Karanasiou A., Dall’Osto M. . Institute of Environmental Assessment and Water Research, CSIC, Barcelona, SPAIN 12th TFMM Zurich 2011
Outline • PM data in Spain: sites • PM levels • PM speciation • Spatial and temporal variation of PM components • Source apportionment • “BC”, as a tracer of traffic emissions • N, sources and processes Contract S-G D Air Quality and Industrial Environment EVALUATION OF PM POLLUTION IN SPAIN
Torrelavega Santander Ponferrada Madrid 2007 Melilla Monitoring sites N=38 Bemantes LLodio Alsasua Montsec L’Hospitalet Pamplona Burgos Montseny Sagrera El Perdón BCN-CSIC 1999-2000 Tarragona Monagrega Alcobendas 2001 Morella Madrid 2002-2003 Vila-real Onda L’Alcora 2002-2004 Palma Borriana 2004 El Saler Badajoz Puertollano Alacant 2003-2005 Bailén 2002-2010 Cartagena Huelva Algeciras Los Barrios La línea PM Speciation Santa Cruz Izaña Las Palmas
A Coruña Montsec Montseny BCN-CSIC Madrid Palma Huelva Arenosillo Santa Cruz BC / N data Izaña
Bulk acidic digestion: HF:NNO3-:HClO4 OC, EC Ion Chromat.: NO3-, Cl-, SO4= ColorimetryFIA and ICP-AES: NH4+, K+, Ca2+, Mg2+,… ICP-AES: Al, Ca, K, Na, Mg, Fe, Ti, P ICP-MS: Li Be P Sc Ti V Cr Mn Co Ni Cu Zn Ga Ge As Se Rb Sr Y Zr Nb Mo Cd Sn Sb Cs Ba La Ce Pr Nd Sm Eu Gd Tb Dy Ho Tm Yb Lu Hf Ta W Tl Pb Bi Th U Leaching SAMPLE TREATMENT and ANALYSIS Quartz fibre filters: Gravimetric determination Chemical analysis Components determined: 75-85% PM TFMM Zurich 2011
PM10 levels TFMM Zurich 2011
Time evolution of PM 1. PMx: BARCELONA 1999-2011 PM10, PM2.5, PM1???
Crustal load in PM10 Saharan dust Resuspension dust TFMM Zurich 2011
Sea spray TFMM Zurich 2011
Secondary inorganic aerosols TFMM Zurich 2011
Secondary inorganic aerosols TFMM Zurich 2011
Carbonaceous compounds TFMM Zurich 2011
Source apportionment Max. Shipping: 3% Traffic: 43% Dem.-res. (reg.): 20% PM2.5 PM1 Max. Shipping: 4% Traffic: 46% Traffic: 50% Max. Shipping: 5% Demolition-resuspension (reg.): 10% Demolition-resuspension (reg.): 1% ME2: Source apportionment in Barcelona: Road dust PM10 Fuente: Tesis doctoral F. Amato CSIC-IJA TFMM Zurich 2011
BC, CO, NO2, NO A large proportion of PM exceedances occur in urban-traffic sites The levels of a number of pollutants co-vary along the day with traffic BARCELONA, urban background, mean values for 2009 Reche et al., 2011, ACPD, 11, 8665-8717
Black carbon (BC) vs PM BARCELONA URBAN SITE PM10 does not always co-vary with traffic LUGANO URBAN SITE N. KENSINGTON URBAN SITE EMPA 2009 DEFRA 2009 Reche et al., 2011, ACPD, 11, 8665-8717
“BC” or EC tracers for road traffic & biomass burning sap (Mm-1) Absorbance (AC, Mm-1) and Black Carbon (BC) BC (µg·m-3) = σ (m2·g-1) Levels of BC compared with EC: MAAP and Sunset (EUSAAR-2, Cavalli et al., 2010, AMT 3, 79-89) EC=AC/10 EC=AC/9 Barcelona (urban) Montseny (rural) Reche et al., 2011, ACPD, 11, 8665-8717
Road traffic, air quality and aerosol measurements 4. BC & N: N vs BC??? Reche et al., 2011. Atmospheric Chemistry and Physics
Number concentration (total >5 nm, Barcelona, 2006-2007) • Mean 19000 #/cm3 • Daily trends • Maxima in traffic rush hours • Midday: nucleation due to photochemistry
N size distribution UFP: N10-800 continuously measured 2004, Barcelona urban background Dall’Osto et al., 2011 ACP (in preparation)
Road traffic, air quality and aerosol measurements Cluster analysis using k-means >6000 hourly size distributions N10-800 1 & 2 clean atlantic advection 3 to 5 traffic pollution Dall’Osto et al., 2011 ACP (in preparation) 6 & 8 summer breeze (Photochem. nucleation) 7 & 9 winter and summer regional Methodology: Beddows et al., 2009. Environmental Science and Technology (U. Buirmingham
Road traffic, air quality and aerosol measurements Source contribution to the mean annual N 10-800 Fuel-Oil comb.; 0.1% Regional / Urban Back.; 25% Photochem.; 3% Marine; 2% Siderurgy; 2% Crustal; 1% Traffic; 67% 7. Receptor modelling for UFP Barcelona Pey J., et al. 2009. Atmospheric Environment
Future trends On-line BC: in situ calibrated with EC EUSAAR-2 On-line XRF analyser: Metals On-line mini-AMS: OM, sulphate, nitrate, chloride, ammonium High time resolution source apportionment But N50 not analyzed currently by AMSThen, UFP measurements will still be necessary, specially if N50 is highly toxic or has cerebrovascular and cardiovascular effects
Spatial distribution of major PM components Time variation of PM and components related to meteorological factors and economical crisis PM10 (mixture of source contributions) and BC (as a source tracer for traffic and biomass burning) offer a good combination for air quality monitoring, specially because exceedances are registered in traffic hotspots Number concentration of ultrafine particles is influenced by several sources and processes and measurements are more complex than BC for standardization purposes Quantitative receptor modeling applied to data sets of PM speciation may offer the possibility of setting limit values for PM contributions from road traffic (relatively homogeneous emission chemical profiles across Europe). However, BC measurements yield similar information, with real time data, low operational cost and easily to standardize method. Source apportionment analysis on size-number concentration and speciation measurements yield quantitative information on sources and processes contributions. In future combination of Mini-AMS + BC + XRF will allow continuous monitoring of most components, but for the finest aerosols, UFP measurements will still be necessary for <45nm), specially if toxicity is high Summary
Acknowledgements: Ministry of the Environment of Spain, Ministry of Sciences and Innovation of Spain Regional AQ monitoring networks: Generalitat Valenciana, Generalitat de Catalunya Andalucía, Baleares, Canarias, Castilla-León, Castilla la Mancha, Euskadi, Extremadura, Galicia, Madrid, Murcia. Also to DEFRA (UK) and EMPA (CH) for providing data on BC and N • Thank you for your attention ! • andres.alastuey@idaea.csic.es • xavier.querol@idaea.csic.es
NO2/BC and CO/BC Are CO/BC, NO2/BC constant across Europe? This would allow avoiding BC measurements, but this is not the case! BARCELONA BERN_KERBSIDE SITE (TRAFFIC)