Download
1 / 23
230 likes | 375 Vues
MICE Particle Rate and ISIS Beam Loss. Adam Dobbs, Target – ISIS Meeting, 17 th September 2010. Outline. Introduction Beamline Analysis Methodology Study Conditions Results November 2009 June 2010 August 2010 Conclusion. 1. Introduction. The MICE Beamline Analysis Methodology.

E N D
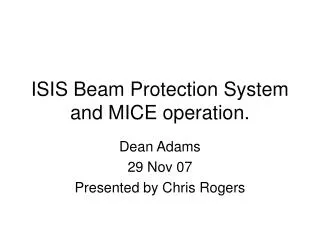
MICE Particle Rate and ISIS Beam Loss Adam Dobbs, Target – ISIS Meeting, 17th September 2010
Outline • Introduction • Beamline • Analysis Methodology • Study Conditions • Results • November 2009 • June 2010 • August 2010 • Conclusion A Dobbs
1. Introduction The MICE Beamline Analysis Methodology A Dobbs
Current MICE beamline D = Dipole bending magnet Q = Quadrupole magnet CKOV = Cherenkov detector KL = KLOE Light detector GVA1 = Scintillator counter TOF = Time of Flight BM = Beam Profile Monitor DS = Decay Solenoid DSA = Decay Solenoid Area LM = Luminosity Monitor Target LM Q1-3 D2 Q4-6 BM2 Q7-9 TOF2 KL ISIS DSA D1 DS MICE Hall GVA1 BM1 TOF0 CKOV A,B TOF1 A Dobbs
binary, sorted by run Target DAQ data gzipped ascii, sorted by time DATE DAQ data Time-of-Flight data extraction with G4MICE TofTree app Data Reduction 1: integrated beam loss analysis, etc Particle rate data extraction with G4MICE Scalers app Reduced Beam Loss data ascii, sorted by time ascii, sorted by run Particle Rate data Time-of-Flight data Apply cuts to find physical tracks and extract number present Combine data by matching time stamps ROOT binary, sorted by run Combined data ROOT binary, sorted by study Reconstructed TOF track data Data reduction 2: extract means and errors for variables on a run-by-run basis (throw away spill-by-spill correlation) Use Sector 7 Integrated Beam Loss per run Match beam loss and TOF track data by run number ROOT binary, sorted by study Final plots of beam loss vs particle rate Final plots of beam loss vs reconstructed tracks ROOT binary, sorted by study A Dobbs
Beam Loss Analysis Methods Target DAQ data Data Reduction 1 – fitted peak beam loss analysis, etc Reduced Beam Loss data Integral Value Peak Value A Dobbs
Study Conditions A Dobbs
2. Results November 2009 15th June 2010 16th June 2010 August 2010 A Dobbs
Nov 09: Rate Vs. Beam Loss A Dobbs
15th & 16th June10: Rate Detectors 15th study: 15 TOF1 hits per 3.2ms spill at 1.3V.ms 25 TOF1 hits per 3.2ms spill at 2V.ms Assuming linearity of rate across the spill: 5 TOF1 hits per 1 ms spill at 1.3V.ms 8 TOF1 hits per 1ms spill at 2V.ms. 1 16th study: 30 TOF1 hits per 1ms spill at 1.3V.ms 60 TOF1 hits per 1ms spill at 2V.ms. NB: 1.3V.ms ~ 2V peak in R8BLM1 A Dobbs
16thJune: TOF PID for Run 2004 • Large peak is mainly muons with perhaps some pion contamination in tail • Small peak to the left is positrons A Dobbs
Reconstructed TOF Tracks Vs. Beam Loss NB Removed run 2011 from 16th plot, bad reconstruction due to DAQ error 16th study: Average # of pulses per run = 361 22 tracks per 1ms spill at 1.3V.ms 33.5 tracks per 1ms spill at 2V.ms 15th study: Average # of pulses per run = 426 6.5 tracks per 3.2ms spill at 1.3V.ms 10.5 tracks per 3.2ms spill at 2V.ms Assuming linearity of rate across the spill: 2 tracks per 1 ms spill at 1.3V.ms 3 tracks per 1ms spill at 2V.ms. → Reduction of ~ 60% for 15th, ~ 40% for 16th Possible causes include particle decay between TOF0 and TOF1 and DAQ deadtime. A Dobbs
Aug 10: Rate Vs. Beam Loss DATE DAQ Gate short and late wrt to spill → target parabola swinging later in spill as depth increases could cause observed non – linear rate increase with beam loss. Tail off at the end of TOF Tracks plot probably caused by DAQ deadtime or software reconstruction inefficiency (although number of particles in whole spill gate is not high, very large beam losses do lead to very large instantaneous rates). A Dobbs
3. Conclusion Summary Future Plans A Dobbs
Summary • Beam Loss varies approximately linearly with target BCD for 25mm ≤ BCD ≤ 30mm, for ‘normal’ short target delay • Particle Rate in the MICE Beamline scales approximately linearly with increasing Beam Loss up to 5V.ms in (Sector 7 Integral) • At 2V beam loss for π → µ optics observed: • 8 TOF1 hits per 1ms spill for –ve • 60 TOF1 hits per 1ms spill for +ve NBRemember doublet optics, and losses due to reconstruction when interpreting this. A Dobbs
Future Plans • No more data runs planned in nearer future • TOF reconstruction – understand why seem to lose particles c.f. Scalers • Model beam line rates with G4BeamLine / G4MICE simulations • Use ORBIT to understand loss patterns around ISIS and relate beam loss to protons-on-target A Dobbs
Spares A Dobbs
Preliminary TOF Analysis A Dobbs