Gasoline Marketing Trends in the USA
Explore the latest data on gasoline marketing trends in the USA, including market share, pricing, sales figures, and industry insights. Learn about key players, sales channels, and consumer preferences in the evolving gasoline market.


Gasoline Marketing Trends in the USA
E N D
Presentation Transcript
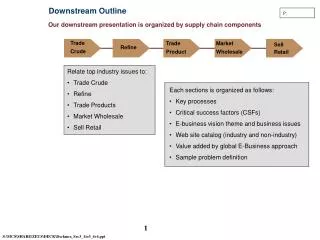
Downstream Training Marketing and other sections Updates for COP
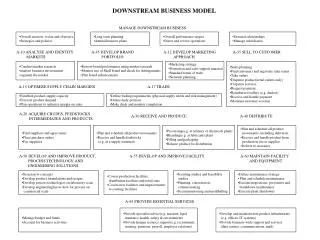
Page 104 Jobbers are Big Business Society of Independent Gasoline Marketers of America… • 2003 Respondents: 247 member companies in all 50 states: • Sells about 32% of the USA motor fuels, through 34,000 sites • C-Store sales $85 billion • 360,000 Employees • Big business… • Purchases petroleum from 10 different suppliers • Median annual sales of 70 million gallons • Can be operating under 2 brands Source: 2004 SIGMA Statistical Report
Page Motor Fuels Pricing System – Typical And, it is very important to know which price is which!... (cents per gallon) Unleaded Unleaded Stage Regular Premium Spota 73.01 79.43 Rackb Majors - Branded 75.85 87.79 Independents - Unbranded 75.57 86.06 DTWc: Dealer Tankwagon 81.15 93.26 Retail: Street (with taxes) 116.40 134.90 a New York spot b Weighted average nationwide rack c Nationwide DTW Source: Oil Daily
Page 16 Passenger Car Fuel Consumption – 1977-2003 Improved fuel consumption has permanently altered gasoline marketing... Passenger Car Efficiency Index Average Miles per Gallon of Fuel Average Miles Traveled Per Car Average Fuel Used Per Car Data was revised by the FHWA in 1986 Energy Information Administration, Monthly Energy Review, Figure 1.9 & Table 1.10, December 1994 Federal Highway Administration, selected highway statistics & charts, Table SS92-18, January 1995
Page Self-Service vs. Full-Service, 1975-1993 Historical perspective: Switch from full-service to self-serve... Percentage Self Service Sales Full Service Sales Saturation level seems to be 87-88% of volume Self-service still illegal in New Jersey and Oregon Amoco Oil Market Research in NPN Fact Book
Page 92 Retail Outlets Reduced with Fuel Economy 2004 – Station count still declining, below 170,000... Gas Sites (000’s) Full Universe Count Includes all facilities that sell retail gasoline: hypermarkets, service stations, C-stores, truck stops, service centers, Mom ‘n Pops. Overall: not a steep decline; change to C-stores. NPN Market Facts 2004
Page 94 Major Brand Retail Outlet Rankings USA Branded Retail Outlets by Rank – 2003... • Following mergers, Shell leads the pack • Shell now marketing in only 40 of 50 states • Valero includes Diamond Shamrock • XOM fell below 16,000 outlets for first time this CENTURY! 2003 No. of 2002 Rank Company Outlets Ranking 1 Shell Oil Products 18,279 1 2 BP America Inc. 14,900 3 3 ConocoPhillips 14,616 4 4 CITGO Petroleum Corp. 13,844 5 5 ExxonMobil 12,473 2 6 Chevron Products Co. 7,827 6 7 Sunoco Inc. 4,528 7 8 Marathon Ashland 3,908 8 9 Valero Energy Corp. 3,300 NA 10 Sinclair Oil Co. 2,124 9 11 Speedway SuperAmerica LLC 1,775 10 12 CHS (Cenex) 1,597 NR 13 Getty Petroleum Corp. 1,313 11 14 Amerada Hess 1,249 13 NPN Market Facts 2004
Page 107 Gasoline Gallons & Relative Market Share USA Market Share: 2003 gross sales of 139.6 billion gallons(a) ... Rank % Share Gross Gal. % Change Company 2003 2002 of Market (000,000) vs. 2002 ConocoPhillips 1 2 15.14% 20,986 11.3% ExxonMobil 2 1 12.94 17,930 (4.0) BP 3 3 12.35 17,120 (0.3) Shell 4 4 11.93 16,541 1.4 Citgo 5 5 11.01 15,257 1.5 MarathonAshland Pet. 6 6 8.54 11,834 (0.2) Chevron Texaco 7 7 7.40 10,255 (1.6) Valero 8 10 4.40 6,100 - Sunoco 9 8 4.59 6,358 - Amerada Hess 10 9 5.12 7,097 1.4 Total 92.95% 129,478 (a) Figures may include some non-highway consumption not reported separately NPN Market Facts 2004
Page Shift in Type of Gasoline Outlets Important growth of C-store segment to retail shown below... Convenience Store Growth – Number of Stores Stores (000s) Sources: National Association of Convenience Stores, U.S. Department of Commerce and PricewaterhouseCoopers L.L.P.
NACS National Association of Convenience Stores State of the Industry Page 97 A Coke... A Smoke... and a Fill-Up Gasoline has accounted for a growing portion of total C-store sales... Gasoline Percentage of C-Store Sales Challenge is to integrate retail merchandising format with commodity, self serve, speed, efficiency of gasoline sale.
Top 10 Product Categories (as a percentage of in-store sales) 2002 2003 1 Cigarettes 34.5% 36.0% 2 Foodservice 13.1 12.3 3 Package Beverage 13.0 12.2 4 Beer 10.9 11.0 5 General Merchandise 4.5 4.0 6 Candy 3.7 3.9 7 Salty Snacks 3.1 2.7 8 Other Tobacco 2.8 2.7 9 Fluid Milk Products 2.6 2.8 10 Packaged Sweet Snacks 1.7 1.8 C-Stores a Complex Operation A mixture of formats and products – difficult to control… Page 100 Page 96 Convenience Store Gross Margins (as a percentage of sales) Gasoline Non-gasoline Average Year Margin (%) Margin (%) Margin (%) 2003 8.8% 30.8% 16.4% 2002 9.1 29.4 16.8 2001 9.2 27.8 16.7 2000 9.3 28.4 16.8 1999 11.7 30.0 19.6 1998 12.0 32.0 20.8 1997 11.3 32.0 20.9 1996 13.1 31.2 20.3 1995 11.8 30.4 20.8 1994 11.1 30.4 20.8 1993 11.9 31.0 20.8 1992 9.9 32.2 20.1 1991 9.2 33.1 20.8 1990 10.4 32.4 20.7 National Association of Convenience Stores State of the Industry Highlights, NPN Market Facts 2004
Page 103 Hypermarkets Market Share France 56% UK 28% USA 8% Hypermarkets – the New Challenge Hypermarket site count 2004 - Growth exploding… Note: Total fuel sites: 3,300 Pacific Northwest 191 / 39 Northern Tier 103 / 24 Rocky Mountain 231 / 53 Northern Seaboard 241 / 55 Midwest 613 / 51 Mid-Continent 172 / 11% Pacific Southwest 249 / 60 Fuel site count / annual build rate Southeast Seaboard 558 / 176 Gulf Coast 914 / 92 Source: NPN Market Facts 2004
IND OVU P4 Crude cost: 28.53 Crude cost: 36.61 2003 Average Retail Price: $1.56/gallon (regular) 2004 Average Retail Price: (through October) 13% 14% ? 13% 15% ? 31% 27% ? 44% ? 43% Determinants of Product Price Crude cost is the most important factor in the price of a gallon of gas… Crude cost: 24.10 2002 Average Retail Price: $1.35/gallon (regular) Distribution & Marketing Refining Costs & Profits Federal & State Taxes Crude Oil Energy Information Administration, Washington DC Primer on gasoline prices
DS OVU P9 NPN 57 Role of Imports in Domestic Demand USA more & more dependent on foreign sources… MBCD Avg. 31.6 33.3 31.5 37.9 39.6 42.5 46.2 47.0 46.6 46.3 49.9 50.7 48.8 51.8 54.5 56.6 55.6 58.2 60.4 58.3 61.1 Imports as % of U.S. demand
Ref P28 Refining Recovery Forecasted in 2002 USA & EU refining could turn profitable…. Source: Morgan Stanley, 12th December 2002
S&T P16 Options Crude Oil 1,000 bbls.; $ per bbl. Strike Calls-Settle Puts-Settle Price Aug. Sept. Oct. Aug. Sept. Oct. 1950 1.28 .81 .63 .13 .47 .79 2000 .88 .55 .43 .23 .71 1.08 2050 .55 .35 .. .40 1.01 .. 2100 .34 .22 .20 .69 1.37 1.85 2150 .20 .. .. .. .. .. 2200 .12 .09 .08 1.47 2.24 .. Est vol 22,728 Tu 4,844 calls 6,390 puts OP int Tues 198,885 calls 150,593 puts Heating Oil No. 2 42,000 gal.; $ per gal. Strike Calls-Settle Puts-Settle Price Aug. Sept. Oct. Aug. Sept. Oct. 50 .0301 .0366 .0435 .0050 .0076 .0096 51 .. .0298 .. .0078 .0107 .. 52 .0167 .0238 .0310 .0115 .0146 .0169 53 .0117 .0185 .0259 .0165 .. .0217 54 .0080 .0145 .0208 .0227 .0252 .0266 55 .. .0112 .. .0310 .. .. Est vol 1,579 Tu 491 calls 420 puts OP int Tues 22,521 calls 9,775 puts Published Price Information Prices from the Wall Street Journal... Futures Crude Oil Lifetime Open Open High Low Settle Change High Low Interest Aug. 19.95 20.70 19.85 20.65 + 0.69 20.75 16.65 84,836 Sept. 19.27 19.90 19.17 19.84 + 0.57 19.90 19.17 42,779 Oct. 18.72 19.35 18.72 19.34 + 0.50 19.40 16.86 26,650 Nov. 18.68 18.95 18.55 19.03 + 0.48 19.02 16.70 22,253 Dec. 18.41 18.66 18.34 18.83 + 0.47 20.40 16.65 33,017 Jan. '97 18.24 18.40 18.23 18.65 + 0.45 18.67 16.70 20,892 Heating Oil No. 2 Lifetime Open Open High Low Settle Change High Low Interest July .5117 .5275 .5117 .5234 + .0017 .5590 .4590 12,828 Aug. .5150 .5300 .5150 .5252 + .0102 .5460 .4645 21,146 Sept. .5200 .5320 .5200 .5292 + .0092 .5470 .4725 9,418 Oct. .5260 .5385 .5255 .5342 + .0087 .5510 .4795 5,600 Nov. .5325 .5410 .5325 .5392 + .0082 .5555 .4870 6,751 Dec. .5380 .5470 .5375 .5447 + .0082 .5595 .4945 18,256
S&T P33 Example: Call Option Call example: The right to buy crude at $16.00 per bbl... Position Premium Dollar Premium Delta Buy one $16 crude oil call $1.09 $1,090 +.53 Maximum risk $1.09 per barrel or $1,090 per contract Maximum profit Unlimited on upside Break-even futures price $17.09 Light, Sweet Crude Oil 5000 4000 3000 2000 1000 0 -1000 -2000 Value of exercised option at @ given price Profit/Loss ($) 11 12 13 14 15 16 17 18 19 20 21 22 23 Premium Futures Price ($)
S&T P34 Example: Put Option Put example: The right to sell crude at $16.00 per bbl... Position Premium Dollar Premium Delta Buy one $16 crude oil put $1.09 $1,090 +.47 Maximum risk $1.09 per barrel or $1,090 per contract Maximum profit Unlimited on downside Break-even futures price $14.91 Light, Sweet Crude Oil 5000 4000 3000 2000 1000 0 -1000 -2000 Profit/Loss ($) Value of exercised option at @ given price Premium 11 12 13 14 15 16 17 18 19 20 21 22 23 Futures Price ($)