Download
1 / 34
350 likes | 481 Vues
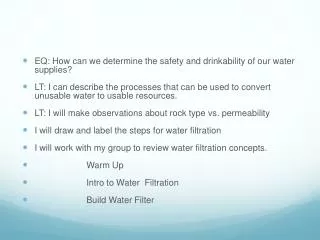
EQ: How can we determine the safety and drinkability of our water supplies? LT: I can describe the indicators of water quality. LT: I will identify the indicators of water quality. I will determine explain how turbidity is measured and how other factors affect turbidity.

E N D
EQ: How can we determine the safety and drinkability of our water supplies? • LT: I can describe the indicators of water quality. • LT: I will identify the indicators of water quality. I will determine explain how turbidity is measured and how other factors affect turbidity. • I will explain how dissolved oxygen is measured and the factors that affect it. Warm Up • Water Quality Notes/Testing
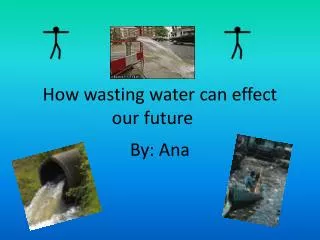
Welcome! Warm Up 3/21/14 • In your opinion, which step in the water filtration process is the most important? • Why?
Brainpop: Water Pollution • Time 3:16 • Why do we need to test the health the water? • How do we test the health of the water?
Google Drive: • 36.Intro into Water Quality • If done early….. • 33.Upwelling Reading • 33.Ocean Habitats • 36.Thirsty Town Article
Notes: Indicators of Water Quality • There are 6 indicators of water quality that we are going to study: • Turbidity • pH • Dissolved Oxygen • Temperature • Nitrates/Ammonia • Bio-Indicators
Turbidity: measure of the degree to which water looses its transparency due to the presence of suspended particulates (“tiny particles”) Definition:
Ideal Level: 1 NTU High Level: 5 NTU and above NTU = Nephelometric Turbidity Units Levels:
Causes of increased turbidity: increased levels of phytoplankton, sediment from erosion, re-suspended sediments from the bottom (stirred by bottom dwellers), waste discharge, algae growth, and urban runoff Causes:
Results of high turbidity: high turbidity increases the absorption of sunlight thus making the water warmer. Warmer water has lower levels of dissolved oxygen causing fish and larvae to die. DO = fish die Results:
Turbidity • Click below • http://goo.gl/CGGyV4
pH: the acidity of the water (presence of hydrogen ion) 07 is acidic 7 is neutral 714 is basic Definition:
Surface Freshwater: 6.09.0 Swamps: as low as 4.3 Salt Water: 8.1 but as low as 7.7 Levels:
Causes of changes in pH: natural conditions (especially in swamps), dumping of waste (batteries) and farm runoff (lime) Causes:
Results of changes in pH: a change in pH by 2 units results in a water system having 100 times a difference in acidity. Most aquatic life cannot withstand water outside of the optimum pH thus resulting in death. Results:
Dissolved Oxygen: the oxygen dissolved in the water Definition:
Average Level: 9.0 ppm Must be 4-5ppm to support diverse population of fish Levels:
Causes of changes in dissolved oxygen: turbulent actions (waves, rapids), water depth, and plant growth Causes:
Results of changes in dissolved oxygen: When DO drops too low fish die. When DO is high, the water actually tastes better but can corrode water pipes. DO = fish die DO = water tastes better Results:
Dissolved Oxygen Questions • Click Here: http://goo.gl/AyflMN
Temperature: measure of average kinetic energy Definition:
Low: cannot be tolerated below 320F High: only rough fish can tolerate temperatures above 970F Levels:
Causes of change in temperature: source of water, time of year, suspended sediment, depth of water, and shade from shoreline vegetation (plants) Causes:
Results of changes in temperature: changes in temperature can make aquatic life susceptible to disease and at extreme levels can result in death Results:
Nitrates: compound that contains the nitrogen based polyatomic ion NO3 (Ex: Sodium Nitrate) Definition:
Drinking Water Max: 10 mg/L Fish: Below 90 mg/L seems to have no effect on warm water fish Levels:
Causes of nitrates: fertilizer runoff (both farm and home), manure pits, leaks in septic systems, animal waste, and rain trapping car exhaust Causes:
Results of presence of nitrates: nitrates can increase the plant production and fish population, resulting in overcrowding. If algae increases, the DO levels can decrease, killing fish. Nitrates are converted to nitrites in humans (can kill children) Results:
Nitrates Video • Click Here • http://goo.gl/yNybUJ
Bio-indicators: macroinvertebrates found living in water (they tend to remain in one place) that are sensitive to pollution Definition:
High Level of Variety: healthy water source Small Level of Variety: poor water source (indicator of high levels of pollution) Levels:
Causes of changes in bio-indicators: pollution that results in changes in pH, temperature, dissolved oxygen, or nitrate levels Causes:
Results of few varieties of bio-indicators present: the lack of a large number of different varieties of bio-indicators is indicative of pollution Results: