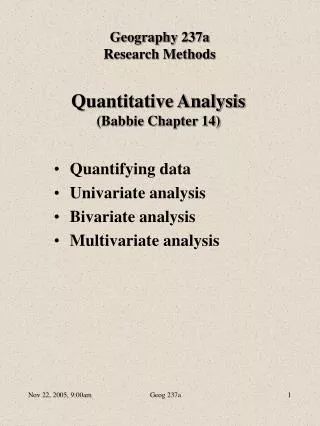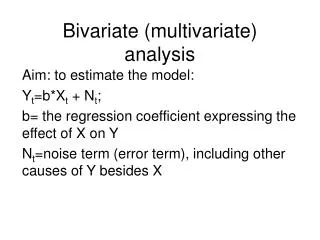
The basic task of most research = Bivariate Analysis
The basic task of most research = Bivariate Analysis. What does that involve? Analyzing the interrelationship of 2 variables Null hypothesis = independence (unrelatedness) Two analytical perspectives: Analysis of differences : Select Independent Variable and Dependent variable

The basic task of most research = Bivariate Analysis
E N D
Presentation Transcript
The basic task of most research = Bivariate Analysis What does that involve? Analyzing the interrelationship of 2 variables Null hypothesis = independence (unrelatedness) Two analytical perspectives: Analysis of differences: Select Independent Variable and Dependent variable Compare Dependent Var. across values of Indep. Var. Analysis of associations: Covariation or Correspondence of variables Predictability of one variable from the other Agreement between two variables
“Bivariate Analysis” Analytical situations: If both variables = categorical?(either nominal or ordinal) Use cross-tabulations (contingency tables) to show the relationship If one variable (dependent)= categorical and other variable (independent) = numerical? Use t-tests or ANOVA to test the relationship What If both variables = numerical? Then cross-tabs are no longer manageable and interpretable T-tests and ANOVA don’t really apply ???
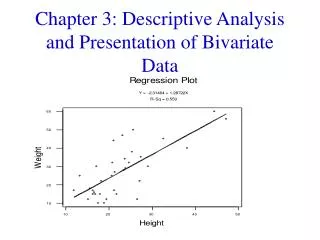
“Bivariate Analysis” Analytical situations: If both variables = numerical? We can graph their relationship scatter plot Need a statistical measure to index the inter-relationship between 2 numeric variables This measure of the inter-relation of two numeric variables is called their “correlation”
“Bivariate Analysis” Footnote: relevant questions about the relationship between variables Does a relationship exist or are they independent? (significance test) What is the form of the inter-relationship? Linear or non-linear (for numerical variables) Ordinal or Nonmonotonic (for ordinal variables) Positive or negative (for ordered variables) What is the strength of the relationship? (coefficient of association) What is the meaning (or explanation) of the correlation? (not a statistical question)
I. Correlation A quantitative measure of the degree of association between 2 numeric variables The analytical model? Several alternative views: Predictability Covariance (mostly emphasizes this model)
I. Correlation The analytical model for correlations: Key concept = covariance of two variables This reflects how strongly or consistently two variables vary together in a predictable way Whether they are exactly or just somewhat predictable It presumes that the relationship between them is “linear” Covariance reflects how closely points of the bivariate distribution (of scores on X and corresponding scores on Y) are bunched around a straight line
Formula for Covariance? Note the similarity with the formula for the variance of a single variable.
Correlation (continued) Scatter Plot #1 (of moderate correlation):
Correlation (continued) Scatter Plot #2 (of negative correlation):
Correlation (continued) Scatter Plot #3 (of high correlation)
Correlation (continued) Scatter Plot #4 (of very low correlation)
Correlation (continued) How to compute a correlation coefficient? By hand: Definitional formula (the familiar one) Computational formula (different but equivalent) By SPSS: Analyze Correlate Bivariate
Correlation Coefficient (r): Definitional Formula Correlation Coefficient (r): Computational Formula
Correlation (continued) How to test correlation for significance? Test Null Hypothesis that: r = 0 Use t-test:
Correlation (continued) What are assumptions/requirements of correlation Numeric variables (interval or ratio level) Linear relationship between variables Random sampling (for significance test) Normal distribution of data (for significance test) What to do if the assumptions do not hold May be able to transform variables May use ranks instead of scores Pearson Correlation Coefficient (scores) Spearman Correlation Coefficient (ranks)
Correlation (continued) How to interpret correlations Sign of coefficient? Magnitude of coefficient ( -1 < r < +1) Usual Scale: (slightly different from textbook) +1.00 perfect correlation +.75 strong correlation +.50 moderately strong correlation +.25 moderate correlation +.10 weak correlation .00 no correlation (unrelated) -.10 weak negative correlation (and so on for negative correlations)
Correlation (continued) How to interpret correlations (continued) NOTE: Zero correlation may indicate that relationShip is nonlinear (rather than no association between variables) Important to check shape of distribution linearity; lopsidedness; weird “outliers” Scatterplots = usual method Line graphs (if scatter plot is hard to read) May need to transform or edit the data: Transforms to make variable more “linear” Exclusion or recoding of “outliers”
Correlation (continued) Scatterplots vs. Line graphs (example)
Correlation (continued) crc319 crc383 dth177 pvs500 pfh493 crc319: Violent Crime rate ----- .614 -.048 .268 .034 crc383: Property Crime rate .614 ----- .265 .224 .042 dth177: Suicide rate -.048 .265 ----- .178 .304 pvs500: Poverty rate .268 .224 .178 ----- -.191 pfh493: Alcohol Consumption .034 .042 .304 -.191 ----- How to report correlational results? Single correlations (r and significance - in text) Multiple correlations (matrix of coefficients in a separate table) Note the triangular-mirrored nature of the matrix