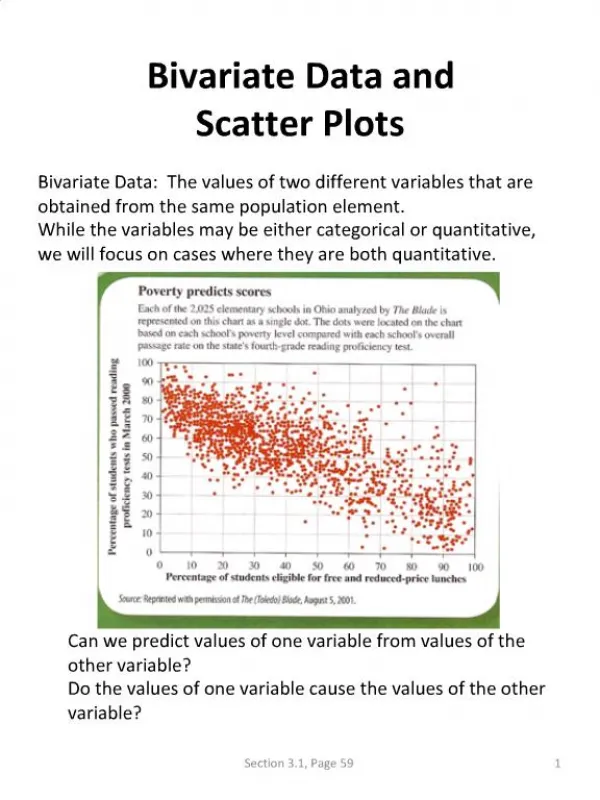
Bivariate Data
Bivariate Data. 3.9 4 credits. Bivariate Data. Learning objectives. Know what bivariate data is plot graphs of bivariate data write reports on bivariate data. A nalysis-. REGRESSION LINE interpret the regression line for your data


Bivariate Data
E N D
Presentation Transcript
Bivariate Data 3.9 4 credits
Bivariate Data Learning objectives • Know what bivariate data is • plot graphs of bivariate data • write reports on bivariate data
Analysis- • REGRESSION LINE • interpret the regression line for your data • state that it is only giving the average increase over the whole graph • the regression line weight = 217.97 x Engine size + 812.32 means that for every one litre in increase in engine size, the weight of the car increases by 217.97 kg on average. NB. include your units
Analysis- • PREDICTIONS • use your regression line to make at least two predictions • one using interpolation (a prediction within the data range) • one using extrapolation (a prediction outside the data range) • show your calculation • comment on how reliable you think these predictions are • round your prediction to match the original data • How widely can these predictions be used?
Analysis- substitute 3 into your regression line formula to get this value • PREDICTIONS • Interpolation • 217.97 x 3 + 812.32 = 1466.23 • Based on my regression line I would predict that a car with a 3 litre engine would weigh approximately 170 kg. I am confident in this prediction as it is right in the middle of my data range and I have similar values to this result.
Analysis- substitute 3 into your regression line formula to get this value • PREDICTIONS • Extrapolation • 217.97 x 10 + 812.32 • Based on my regression line I would predict that a car with a 10 litre engine would weigh approximately 2990 kg. I can not be confident in this prediction as i do not have any cars to compare it to.
Analysis- • CONFIDENCE IN PREDICTIONS • add dotted lines manually to your graph • you can now see the values the weight of the car lies between From the graph I can now see the prediction I made earlier for a car with a 3 litre engine is likely to lie between 1280 kg and 1650 kg (as shown by the light grey lines) and is unlikely to be exactly 1470kg.
Analysis- • CAUSATION • a causal relationship exists if the occurrence of the first event causes the second. Examples of this might be hot weather and the sales of ice cream, or the amount of revision done and the final result. • Causal relationships can only be determined by controlled experiments. • A lurking variable is a variable that is responsible for the relationship between your x and y variables. For example, a positive correlation exists between shoe size and reading ability but increasing a person’s shoe size does not increase their reading ability. The lurking variable here that influences the other two is age!
Analysis- • RESIDUALS • use iNZight to create a plot of the residuals • use the plot to justify how accurate you think your predictions are NB. the dotted line at 0 represents your regression line red line – middle of green lines if the red and green lines bend away from your line you should try a different model
A residual plot allows you to determine if your regression model is a good fit to your data. When plotted, the residuals should a) be horizontal. If the residuals are curved or have a slope, then your regression model is not accounting for all but the random variation in the data. b) have about the same width throughout the range. If they don't, then your model doesn't meet the requirement for equal variance. c) be uniformly scattered along the horizontal axis. If they aren't then your data are clustered and your regression model could be biased. d) be random. There should be no recognizable pattern. Good regression models give uncorrelated residuals.
We use residual plots to see if the observed error is random and unpredictable
Looking at my residuals plot I think that the first car I predicted to weigh 1470kg might actually weigh slightly more than this due to most of the values being above the predicted line in the middle of the range. Based on looking at the residuals the car that I predicted would weigh 2990kg probably will not weigh this much as the weighted average line shows a clear curve downwards, but I do not have any other cars to compare it to.
Your turn White booklet page 23 Nulake