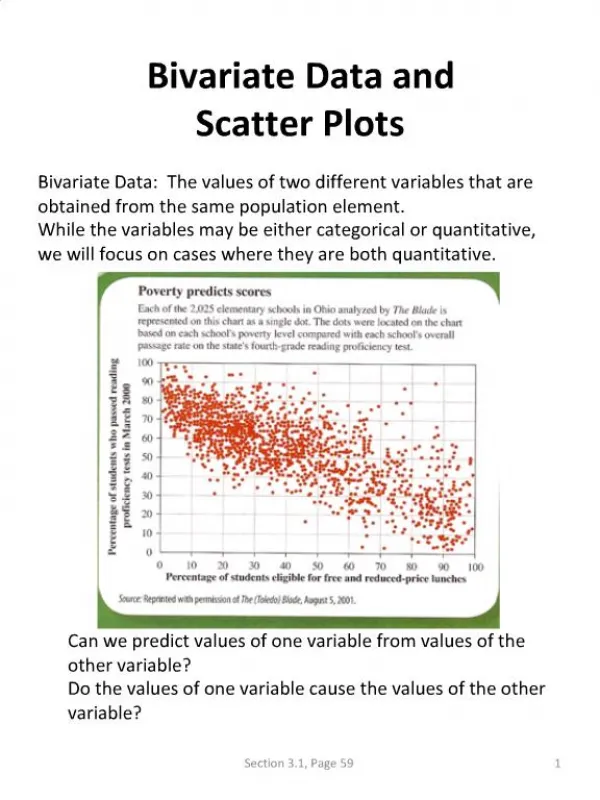
Bivariate Data
Bivariate Data. Notes for Merit Comparing two Bi- variate plots. Problem. Can the height of a A.I.S. Athlete in cm be used to predict the LBM in Kg’s? Or Can the weight of a A.I.S. Athlete in Kg’s be used to predict the LBM in Kg’s?


Bivariate Data
E N D
Presentation Transcript
Bivariate Data Notes for Merit Comparing two Bi-variate plots
Problem • Can the height of a A.I.S. Athlete in cm be used to predict the LBM in Kg’s? • Or Can the weight of a A.I.S. Athlete in Kg’s be used to predict the LBM in Kg’s? • Is the weight or the height of a AIS Athlete a better predictor of LBM? • Red for Merit Blue for Achieved.
Plan • iNZight will be used to graph BOTH relationships and form LINEAR models. It will then be decided if the models are reliable, and which model is the best. • For the strongest relationship an estimate will be made of the dependent variable using the independentvariable. The model will then be split by gender and these relationships will be compared with the entire relationship. • The PPDAC cycle will be used to structure the report.
Data (Explain the variables in context) • Height is measured in cm. Weight and Lean Body Mass are measured in kg. • Weight - Fat = Lean Body Mass • Lean Body mass refers to the sum of the weight of your bones, muscles and organs... basically the sum of everything other than fat in your body. http://www.halls.md/body-mass-index/leanbody.htm • The data is taken from athletes in the Australian Institute of Sport http://www.ausport.gov.au/ais
Analysis • For every 1cm increase in height there is approximately a 1Kg increase in lean body mass. • For every 1Kg increase in weight there is approximately a 0.9Kg increase in lean body mas. (TARSOG) • Both relationships has significant, positive,linear trends. The scatter in the LBM vs height graph is slightly greater either side of the trend line when compared with LBM vs weight plot. This was expected and is highlighted by the correlation coeffient being higher for LBM vs weight.
Analysis • There are no obvious outliers in the LBM vs weight graph, however, in the LBM vs height graph there are two athletes at approximately 190cm in height, who have higher than expected LBM (very little body fat). • There are no groupings of such in either of the plots. I will now separate weightvs LBM by gender to investigate the possibility of a stronger relationship. • Given that weight is a better predictor of LMB than height I’ve decided to investigate this model further by separating the plots into a male and female plot.
Analysis • When the scatter plot is split into males and females the linear trend line correlation improves. When the males and females were combined the r = 0.87 when split the correlation coefficient increased to 0.92 for females and 0.97 for males. • When looking at the split scatter plots the scatter is closer to the line of best fit for males than for females. It is also interesting that for heavier athletes the scatter slightly spreads away from the line of best fit.
Conclusion Prediction of LBM given height: Female prediction: Male prediction: General prediction: In this instance I think it is most appropriate to interpolate at roughly the mean height (i.e. 180cm) of athletes because ….. Prediction of LBM given weight: Female prediction: Male prediction: General prediction: Evaluate predictions and answer the original problem.