1.11 Bivariate Data
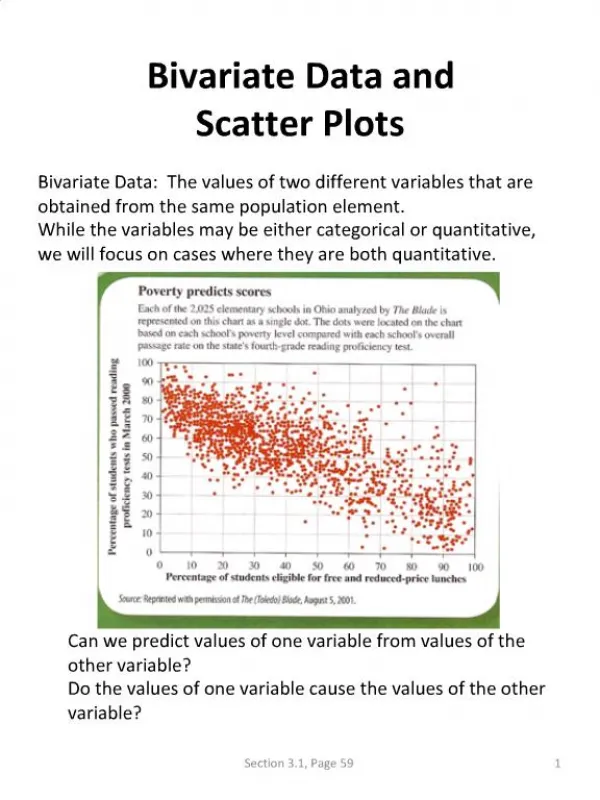
1.11 Bivariate Data. Credits 3 As91036. Achieved, Merit or Excellence. Achievement You need to use investigate bivariate numerical data using the statistical enquiry cycle. (See Statistics revision ). Numerical data:


1.11 Bivariate Data
E N D
Presentation Transcript
1.11 Bivariate Data Credits 3 As91036
Achievement • You need to use investigate bivariate numerical data using the statistical enquiry cycle. (See Statistics revision). • Numerical data: • the x variable or explanatory variable may be a continuous or discrete numerical variable, eg the different lengths set for a pendulum in an experiment, or the number of books in a back-pack in a survey • the y-variable or response variable must be a numerical variable where the numbers measure the quantity of interest. • Make sure that you are familiar with the statistical enquiry cycle which involves: • planning and conducting an investigation involving bivariate numerical data • working with a given relationship question • determining appropriate variables and measures • managing sources of variation • gathering data • selecting and using appropriate display(s) • communicating relationship(s) in the data in a conclusion.
Achievement with merit Make sure that you can meet the criteria for achievement You need to investigate bivariate numerical data using the statistical enquiry cycle with justification. This involves linking aspects of the statistical enquiry cycle to the context and the population. Justification also involves making supporting statements which refer to evidence such as summary statistics, data values, trends or features of visual displays.
Achievement with excellence Make sure that you can meet the criteria for merit You need investigate bivariate numerical data using the statistical enquiry cycle with statistical insight. This means integrating statistical and contextual knowledge throughout the statistical enquiry, reflecting about the process and may involve considering other explanations.
Statistics Revision Bitesize revision – Statistics Displaying data Line of best fit Regents Prep: Scatter plots and line of best fit Interactive: Scatter Plot and line of best fit Onlinemathlearning: Scatter plot and the line of best fit Graphing and interpreting bivariate data Statistical Enquiry Cycle How kids learn – the statistical enquiry cycle CensusAtSchool
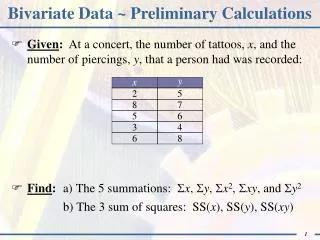
Using your calculator to find summary statistics. • Select 2 from the menu to get STAT. • Delete any existing data by pressing F6 F4 F1 {(more) DEL_A YES] and repeat if required • Move the cursor to column one and enter the data values. • 12, 15, 21, 14, 13, 12, 11, 24, 19, 17, 18, 17, 21, 12, • Select F2 F6 (CALC, SET) and check that 1Var Xlist: list1 and 1Var Freq: 1 • Then press EXE F1 • Scrolling down what summary statistics have you been given?
Using your calculator to find summary statistics from a frequency table. • Select 2 from the menu to get STAT. • Delete any existing data by pressing F6 F4 F1 {(more) DEL_A YES] and repeat if required • Move the cursor to column one and enter the data values for Bullseyes.
Using your calculator to find summary statistics from a frequency table. • Move the cursor to column two and enter the frequency. • Select F2 F6 (CALC, SET) and check that 1Var Xlist: list1 and 1Var Freq: 1 • Then press EXE F1 • Scrolling down what summary statistics have you been given?
Using your calculator to find summary statistics from a frequency table. • Select F2 F6 (CALC, SET) and check that 1Var Xlist: list1 and 1Var Freq: list2 • Then press EXE F1 • Scrolling down what summary statistics have you been given?
Success Criteria • I can find summary statistics Nulake questions 1, 4, 7, 10 find mean, mode, median 18, 21, 24, 27 LQ, UQ median our data find mean, median, mode, LQ, UQ 30, 32, 33, 35, 38 using a frequency table 39 – 45 using a grouped frequency table
The Statistical Enquiry Cycle how to write a report
Make sure that you are familiar with the statistical enquiry cycle which involves: • planning and conducting an investigation involving bivariate numerical data • working with a given relationship question • determining appropriate variables and measures • managing sources of variation • gathering data • selecting and using appropriate display(s) • communicating relationship(s) in the data in a conclusion.
P P D A C • why did I choose to look at this problem • what do I want to find out roblem • what data do I need to collect • who am I collecting my data from (and why) • how large should my sample be • how am I going to analyse my data lan • Collect • Clean • display (iNZight) ata • summary statistics • trend line • prediction • association - strong/moderate/weak correlation • scatter evenly distributed along the trend line? • outliers • grouping does the data form clusters anywhere? nalysis onclusion • Answer the question you set at the beginning • refer back to your results • suggest how you might improve or extend your investigation
P roblem • why did I choose to look at this problem • what do I want to find out why I have been given . . . . . . . . . and am interested in looking at whether there is a connection between . . . . . . . . and . . . . . . . . I have been looking at . . . . . . . . . . . and am interested in finding out if there is a connection between . . . . . . . . . . and . . . . . . . . . what I wonder if there is a relationship between _________________ and ___________.
P lan • what data do I need to collect • should I collect primary data or use secondary data? • who am I collecting my data from (and why) • how large should my sample be • how am I taking my sample (sampling techniques) • how am I going to analyse my data
D ata • Collect – fair and consistent • Clean – justify any data you remove • display (iNZight)
A nalyse • summary statistics • trend line - also known as regression lines • prediction • association - strong/moderate/weak correlation • scatter evenly distributed along the trend line? • outliers • grouping does the data form clusters anywhere?
C onclusion • Answer the question you set at the beginning • refer back to your results • suggest how you might improve or extend your investigation from my analysis I have found that . . . . . . . . To improve my investigation I could . . . . . . . . . To extend my investigation I could