Download
1 / 1
10 likes | 141 Vues
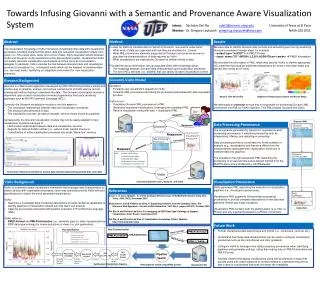
Towards Infusing Giovanni with a Semantic and Provenance Aware Visualization System. Data Processing Provenance. Giovanni. Abstract. Method. Results.

E N D
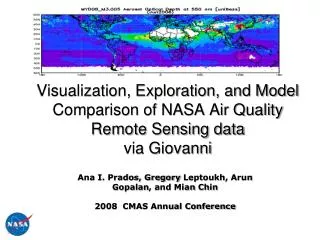
Towards Infusing Giovanni with a Semantic and Provenance Aware Visualization System Data Processing Provenance Giovanni Abstract Method Results The visualization Knowledge (VisKo) framework dynamically links data with visualization processes, provided characteristics about data and requested visualization targets from users (i.e., time series plots, raster and contour maps). Early integration efforts between VisKo and Giovanni, a fully operational online data analysis system, revealed that VisKo can satisfy Giovanni visualization requirements and thus serve as a visualization delegate. In particular, VisKo provides the link between Giovanni data and visualization services at conceptual (i.e., ontological) levels which can be mapped to implementation (i.e., services) levels, facilitating an adaptable environment for new visualization scenarios. • In order for VisKo to visualize data on behalf of Giovanni, we need to understand: • What kinds of data are supported and how they are encoded (i.e., format) • What XML provenance elements supported by Giovanni can serve as sources to populate the characterizations of data required by VisKo • What visualizations are expected by Giovanni for different kinds of data • Provided the above information, we can populate VisKo with knowledge about: • The mappings between Giovanni data characteristics and visualization processes • The set of NCL services (i.e., plotters) that can satisfy Giovanni visualization criteria • We were able to identify Giovanni data formats and semantic types from by examining Giovanni provenance lineage-steps, for example: • <output type="netCDF”> PMLP:Format • <input- name="D1">MYD04_L2.051:AOD0470corr-l:medn> PMLP:Information • We encoded this information in PML, which was used by VisKo to identify appropriate NCL pipelines that visualize brightness temperature as contour and raster maps and aerosol time series as XY plots. • We developed an extractorservice that is responsible for translating Giovanni XML provenance into PML for VisKo ingestion. This PML bridges Giovanni and VisKo. Giovanni-VisKo Model Giovanni Background • Giovanni: • Forwards user visualization requests to VisKo • Forwards XML provenance describing the processing associated with data requested by users • VisKo in turn: • Translates Giovanni XML provenance to PML • Generates requested visualizations, leveraging the translated PML • Returns visualization along with data + visualization PML • Giovanni is a Web-based application developed by GES DISC that provides a simple and intuitive way to visualize, analyze, and access vast amounts of Earth science remote sensing data without having to download the data. The Giovanni visualization module is dependent upon a set of visualization services supported by third party rendering packages such as NCAR Command Language (NCL). • Currently, the Giovanni visualization module is not fully aware of: • The conceptual relationships between data and visualization processes • The structure and semantics of data • The visualization process as sets of reusable service chains known as pipelines • Consequently, the Giovanni visualization module may not be easily adapted to new visualization scenarios because of: • Hard coded relationships between data and visualization services • Regards for data as holistic entities (i.e., without much internal structure) • Consolidation of entire visualization processes into single “black-box” services Brightness Temperature Contour and Raster Maps Aerosol Time Series Plot Request Giovanni PML Data Processing Provenance Response Giovanni Search [MAPPS} • The provenance generated by Giovanni is regarded as data processing provenance; it describes processing such as interpolating, filtering, and adjusting or correcting. • Data processing serves to corral data into forms suitable for analysis (e.g., visualization) and therefore differs from the transformations associated with visualization, which aim to translate data into graphics. • The example to the right represents PML describing the processing of an aerosol time series dataset fetched from the MAPPS data store and filtered by HTTPSubsetter. MAPPS Data Store Response References References Request Giovanni HTTPSubsetter Screenshot of Giovanni interface for aerosol data selection along with associated time series plot Visualization KB VisKo Background Visualization Provenance Interaction between users, Giovanni, and VisKo Visualization Provenance • VisKo generates PML describing the execution of visualization pipelines (i.e., visualization provenance). • Visualization PML augments Giovanni data processing provenance to provide complete descriptions of how data was gathered, filtered and finally visualized. • Visualization PML contains both the plotting steps (e.g., NCL xy Plotter) and any arguments passed to xyPlotter (not shown). • VisKo is a semantic aware visualization framework that leverages data characteristics to match up data with visualization processes; users may optionally provide VisKo with plot specifications to restrict the set of generated visualizations. • VisKo: • Searches a knowledge base containing descriptions of toolkit rendering capabilities to identify pipelines of visualization-related services that it can execute • Captures provenance associated with pipeline execution in Proof Markup Language (PML) • VisKo relies on: • PMLP:Format and PMLP:Information (i.e., semantic type) for data characterizations • ESIP data-type ontology for characterizations of views (i.e. plot geometries) References NCL Acker, J. G and Leptoukh , G. Online Analysis Enhances Use of NASA Earth Science Data, Eos Trans. AGU, 88(2), December 2007 McGuinness, D and PinheirodaSilva, P. Explaining Answers from the Semantic Web: The Inference Web Approach. Journal of Web Semantics. Vol.1 No.4., pages 397-413, October 2004. Del Rio, N and Pinheiroda Silva, P. Leveraging an ESIP Data-Type Ontology to Support Visualization. AGU, Poster, December 2010 Del Rio, N and Pinheiroda Siva, P. Visualization Knowledge (VisKo) Website. http://trust.utep.edu/visko xyPlotter VisKo VisKo PML Future Work Data Characterization Plot Specification • Further characterize data beyond type and format (i.e., continuous, nominal, etc.) • Understand how these data characteristics can be used to configure visualization geometries such as line smoothness and color gradients • Configure VisKo to leverage more data processing provenance when identifying pipelines and parameter settings, rather than relying only on PMLP:Information and PMLP:Format • Develop viewers that display visualizations along with provenance in ways that provide users with useful balances of context needed to understand the plot but with a level of conciseness that does not impair the readability PMLP:Aerosol PMLP:hasType PMLP:hasFormat PMLP:netCDF PMLP:hasURL http://nasa… NCL netCDF Reader NCL gsn_csm_xy2 Pipeline Search GhostScript PDF2PNG GhostScript PS2PDF Portable Network Graphic Portable Document Format PostScript NCL Data Model Synthesized Visualization Pipeline VisKo pipeline search using SPAQL queries Visualization KB