Download
1 / 24
250 likes | 444 Vues
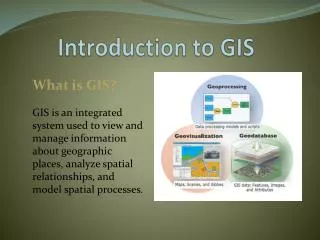
Introduction to GIS for the Purpose of Practising PGIS. Basic Functions of Geographical Information Systems. By: Jon Corbett and Kasondra White. Unit: M12U03. Introduction. This Unit will explore: GIS functions; analytical capabilities; creating a map; querying; spatial analysis; GPS.

E N D
Introduction to GIS for the Purpose of Practising PGIS Basic Functions of Geographical Information Systems By: Jon Corbett and Kasondra White Unit: M12U03
Introduction • This Unit will explore: • GIS functions; • analytical capabilities; • creating a map; • querying; • spatial analysis; • GPS.
Creation • Community-specific information may need to be created from scratch. • Community members may wish to apply their own naming schemes. • Community members may simply wish to edit maps that already exist.
Map scanning and digitising • The process of passing a paper map through a scanner • Map is then incorporated into a GIS and displayed/analysed • Can be scanned at high or low resolution • A preliminary step in working with GPS
Map scanning and digitising • May wish to convert scanned image (i.e. raster image) to a different data type (i.e. vector) • Some software packages do this automatically • Manual digitising – clicking on features on a paper map using a “puck and tablet”
Coordinate systems • Choosing a Coordinate Reference System (CRS) • Generally, the same CRS will be applied to every layer • Failure to do this will compromise the validity and analyses that can be performed
Projections • Defines how 3-D information about the Earth is transferred to a 2-D surface • Necessary because spheres cannot be shown on flat surfaces without distortion • Layers displayed together must be projected in the same way • Certain analyses are only valid when certain types of projections are used
Georeferencing • The process of applying spatial attributes to map layers • Applies a CRS to an image • Defines relationship between objects and geographic features that are present in layers • Involves associating coordinates with features
Assigning attributes • Each feature has two types of data associated with it: • locational information (set by georeferencing) • descriptive information (entered into Attribute Table)
Assigning attributes • Basic items include: • name of feature • area or distance of feature • label for feature • unique id number
Labelling features • Label for: • aesthetic purposes • practical purposes • Can be turned on or off • Label properties can be edited
Editing data layers • Can toggle editing on and off • Creating new points, lines and polygons • Attributing information to data points • Editing can also be turned on when working with the Attribute Table to add or manipulate data displayed in the table
Querying • Searching for information using the Attribute Table • Find by location: • searches according to spatial locations • Find by attribute: • search by attributes included in the Attribute Tables • simple and advanced searches • multiple and comparative criteria
Spatial analysis • Understanding the distribution of phenomena across a geographic space • Examples include: • relationships between smog and health • active hunting grounds and wildlife corridors • areas of high criminal activity • occurrences of rare and endangered species
Map overlays • Features from two input layers are overlaid • Features from each layer create new output features • Can be done in steps: • two input layers are combined into an intermediate layer • intermediate layer is combined with a third layer • this continues until desired map is achieved
Spatial joins • Relating information from one layer with that contained in another • Draws all of the objects into a new layer • A new Attribute Table is created • Related to overlays
Choropleth mapping • Provides a visual representation of themes or items of interest • Regions are formed based upon data associations • Criteria set by map makers • Examples include maps depicting: • voter preference • annual income within a region or country
Buffering • Users define a zone around each point, line or polygon • Buffer forms a new polygon, which can be used in queries • A way of searching for information according to: • location • proximity
GPS • Uses satellites to capture points of interest • Useful for recording locations and transferring onto a map • Not always accurate • May not be able to retrieve a signal • Performance affected by weather • Lends a degree of credibility to a project
Adding and analysing GPS data points • Points can be uploaded and added to maps • Points appear as a layer on their own • Map makers can attribute information to points • Map makers can perform operations based on uploaded points