Download

1 / 37
400 likes | 767 Vues
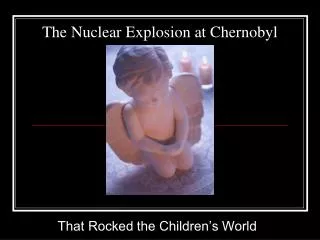
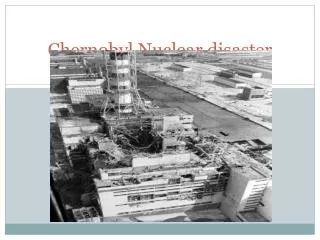
Chernobyl Nuclear Power Plant Explosion. Analysis of Long Term Effects on Land Use Patterns. Introduction. April of 1986 a nuclear accident damaged a reactor at the Chernobyl nuclear power plant in Ukraine. released substantial radioactive material into the environment (NRC.gov ).

E N D
Chernobyl Nuclear Power Plant Explosion Analysis of Long Term Effects on Land Use Patterns
Introduction • April of 1986 a nuclear accident damaged a reactor at the Chernobyl nuclear power plant in Ukraine. • released substantial radioactive material into the environment (NRC.gov). • At the time of the accident the area surrounding the Chernobyl Plant was mainly used for agriculture. • Contamination so toxic that hundreds of thousands of residents were ordered to evacuate. • The focus of our project is on the long term effects this catastrophe had on the land use patterns around the Chernobyl Nuclear Power Plant using Landsat images.
Methodology • Landsat 4 image of the area surrounding the Chernobyl Nuclear power plant before April, 1986. • Landsat 7 image of the area surrounding the Chernobyl Nuclear power plant after April, 1986. • ERDAS IMAGINE 2011 • ArcGIS 10.1 (ArcMap and ArcCatalog) • Resampled both images to 60 meter and 120 meter resolution. • Classified them by land use/cover using the supervised method. • Used bands 3 and 4 from all images to determine the normalized vegetation difference index (NDVI) in each. • Analyzed
Resampling Pixel Size • 3 main resampling methods • Bilinear interpolation • Cubic convolution • Nearest Neighbor
Bilinear interpolation • takes a weighted average of four pixels in the original image nearest to the new pixel location
Cubic convolution • Similar to Bilinear Interpolation but uses weighted average of 16 pixels in the original image nearest to the new pixel location
Nearest Neighbor • Uses the digital value from pixel in the original image which is nearest to the new pixel location in the corrected image.
Reasons for Using Nearest Neighbor • Transfers original data values, does not average as other two methods do. • As result, extreme and subtle values are preserved, which would provide more accurate results after classification. • Easier to use and faster to compute than other methods.
Chernobyl Area Results August 1985: 30 meter resolution
Chernobyl Area Results August 1985: Resampled to 60 meter resolution
Chernobyl Area Results August 1985: Resampled to 120 meter resolution
Chernobyl Area Results August 2001: Resampled to 30 meter resolution
Chernobyl Area Results August 2001: Resampled to 60 meter resolution
Chernobyl Area Results August 2001: Resampled to 120 meter resolution
Measuring Vegetation Before and After the Chernobyl Accident using Landsat Imagery Measuring the amount of green vegetation using Normalized Vegetation Difference Index (NDVI),
Measuring the amount of green vegetation • The NDVI is the ratio of the difference between the reflectance in the red and near infrared bands divided by the total reflectance in these two bands. • NDVI = (band 4(NIR) – band 3(Red))/(band 4(NIR) + band 3(Red)). • NDVI ranges from +1 to -1. Positive values indicate healthy green vegetation, values near 0 indicate bare land, and negative values represent clouds, water, or snow (because they reflect red better than NIR).
Classification into vegetated and non-vegetated areas • The areas have been classified into vegetated and non – vegetated based on the NDVI values using manual feature. • This can be done manually or using an automated classification feature. • The automated feature is useful for obtaining a quick view of the area that is vegetated and the area that is not. • In this case the manual method was used in order to calculate areas.
Calculated NDVI for August, 2001 30, 60, 120 m +1 indicate healthy green vegetationValues near 0 indicate bare land-1 no vegetation
Comparing images: One year before the accident and 15 years after (August, 1985 and 2001)
Comparing images: One year before the accident and 15 years after (August, 1985 and 2001)
Comparing images: One year before the accident and 15 years after (August, 1985 and 2001)
Calculated Areas in hectares:The area was calculated by multiplying the pixel counts (the number of raster cells) by cell size 30 x30, 60x60, and 120x120
Calculated Areas in hectares:The area was calculated by multiplying the pixel counts (the number of raster cells) by cell size 30 x30, 60x60, and 120x120
Data and Methodology: • Based on supervised classification we classified the images into five major classes: water, forest, agriculture, urban and vegetation. • Download Landsat 4 TM (1985) and Landsat 7 (2001) ETM from USGS website. • Unzip two zipped files into folders as TIFF files for each bands. • Stack them together using for generate an .IMG file. in ERDAS • Sample five areas in each and generate a signature file. • Combineall same sample areas (polygons) into a class, name and color it. • Store the final version of your signature file as a .sig file. • Subsetoriginal, supervised classification images. • Run Change Detection Tool.
Results: • The Chernobyl accident took place during the harvesting season (mid-to-late August). It was found in the study that some areas had been possibly harvested before and some after images taken. Thus, it is possible to find bare, reformed field-crop and open areas all over the study area.
True-Color Images: 30-meter resolution 1985 2001 Based on these images we can assume that the urban area was abandoned. As shown, there are very few patterns of field crops in 2001.
Classified Images: 1985 2001 Supervised classification shows differences between two images quite clear. Bright green represents agriculture, swamp and low-density forest. All areas used to be urban, bare, field-crop and open areas turned to green instead.
Change Detection: Change Detection Highlighted Change Detection DECREASE INCREASE To prove that the classified images were correct, we employed the change detection tool. These images also indicate the same result. Red areas represent decreasing and green is supposed to indicate an increase of land use. In this case, green-color polygons are cloud in the study area.
Conclusion • Our NDVI analysis showed a vegetation decrease of 377,863 hectares (931.6 acres) from 1985 to 2001. • We also identified 53,708 hectares (131 acres) of re-vegetated areas, meaning areas that were not vegetated in 1985 but were in 2001. • Suspect some of these re-vegetated areas pertain to towns that were populated in 1985 and abandoned by 2001, which allowed for wild vegetation growth. • We also analyzed the decrease in vegetation from 1985 to 2001, based on our supervised classification, we believe this refers to the indicated increase in bare areas in 2001, which in 1985 were used for agriculture and were vegetated. • Minimal distortion in total area as result of re-sampling: < 1%