
Exploring Graphs and Functions: Fundamentals and Applications
E N D
Presentation Transcript
Graphs, Functions,and Models Chapter 1
1.1Introduction to Graphing • Plot points. • Determine whether an ordered pair is a solution of an equation. • Graph equations. • Find the distance between two points in the plane and find the midpoint of a segment. • Find an equation of a circle with a given center and radius, and given an equation of a circle, find the center and the radius. • Graph equations of circles.
Cartesian Coordinate System I (+, +) II (, +) (x, y) (0,0) III (, ) IV (+, )
Solutions of Equations • Equations in two variables have solutions (x, y) that are ordered pairs. Example: 4x + 5y = 20 • When an ordered pair is substituted into the equation, the result is a true equation.
Determine whether the ordered pair (4, 2) is a solution of 3x + 4y = 2. 3(4) + 4(2) ? 2 12 + 8 ? 2 4 2 false (4, 2) is not a solution. Determine whether the ordered pair (2, 1) is a solution of 3x + 4y = 2. 3(2) + 4(1) ? 2 6 + 4 ? 2 2 = 2 true (2, 1) is a solution. Examples
Graphs of Equations • To graph an equation is to make a drawing that represents the solutions of that equation.
x-Intercept • The point at which the graph crosses the x-axis. • An x-intercept is a point (a, 0). To find a, let y = 0 and solve for x. • Example: Find the x-intercept of 3x + 5y = 15. 3x + 5(0) = 15 3x = 15 x = 5 The x-intercept is (5, 0).
y-Intercept • The point at which the graph crosses the y-axis. • A y-intercept is a point (0, b). To find b, let x = 0 and solve for y. • Example: Find the y-intercept of 3x + 5y = 15. 3(0) + 5y = 15 5y = 15 y = 3 The y-intercept is (0, 3).
Example • Graph x + 2y = 6. • x-intercept: x + 2(0) = 6 x = 6 (6, 0) • y-intercept: (0) + 2y = 6 2y = 6 y = 3 (0, 3) (0, 3) (6, 0)
1. Select values for x. 2. Compute values for y. Example • Graph y = x2+ 2x 3 = 0 • Make a table of values.
The Distance Formula The distancedbetween any two points (x1, y1) and (x2, y2) is given by . Example: Find the distance between the points (2, 2) and (3, 5).
If the endpoints of a segment are (x1, y1) and (x2, y2), then the coordinates of the midpoint are . Example: Find the midpoint of a segment whose endpoints are (5, 6) and (4, 4). Midpoint Formula
Circles • A circle is the set of all points in a plane that are a fixed distance r from a center (h, k). • The equation of a circle with center (h, k) and radius r, in standard form, is (x h)2 + (y k)2 = r2.
Example • Find an equation of a circle having radius 7 and center (4, 2). Using the standard form: (x h)2 + (y k)2 = r2 [x 4]2 + [y (2)]2 = 72 (x 4)2 + (y + 2)2 = 49.
(4, 1) Example • Graph the circle (x + 4)2 + (y 1)2 = 9 Write the equation in standard form. [x (4)]2 + [y 1]2 = 32 The center is (4, 1) and the radius is 3.
1.2Functions and Graphs Determine whether a correspondence or a relation is a function. Find function values, or outputs, using a formula. Find the domain and the range of a function. Determine whether a graph is that of a function. Solve applied problems using functions.
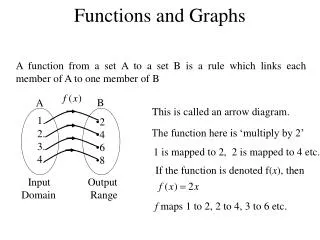
Function A function is a correspondence between a first set, called the domain, and a second set, called the range, such that each member of the domain corresponds to exactlyone member of the range. Function Not a Function 7 49 2 4 7 5 7 0 0 6 3 2 4 8 2
Relation A relation is a correspondence between the first set, called the domain, and a second set, called the range, such that each member of the domain corresponds to at leastone member of the range. Which of the following relations is a function? {(8, 2), (8, 4), (7, 3)} Not a function {(6, 4), (1, 4), (7, 4)} Function
Notation for Functions • The inputs (members of the domain) are values of x substituted into the equation. The outputs (members of the range) are the resulting values of y. • f(x) is read “f of x,” or “f at x,” or “the value of f at x.” • Example: Given f(x) = 3x2 4, find f(6). f(6) = 3(6)2 4 = 3(36) 4 = 104
Graphs of Functions • We select values for x and find the corresponding values of f(x). Then we plot the points and connect them with a smooth curve. • The Vertical-Line Test If it is possible for a vertical line to cross a graph more than once, then the graph is not the graph of a function.
Example: Does the graph represent a function? The graph is a function because we cannot find a vertical line that crosses the graph more than once.
Example: Does the graph represent a function? The graph is not a function. We can find a vertical line that crosses the graph in more than one point.
Finding Domains of Functions Find the indicated function values and determine whether the given values are in the domain of the function. f(1) and f(5), for f(1) = Since f(1) is defined, 1 is in the domain of f. f(5) = Since division by 0 is not defined, the number 5 is not in the domain of f.
Another Example Find the domain of the function Solution: We can substitute any real number in the numerator, but we must avoid inputs that make the denominator 0. Solve x2 3x 28 = 0. (x 7)(x + 4) = 0 x 7 = 0 or x + 4 = 0 x = 7 or x = 4 The domain consists of the set of all real numbers except 4 and 7 or {x|x 4 and x 7}.
Visualizing Domain and Range Keep the following in mind regarding the graph of a function: • Domain = the set of a function’s inputs, found on the horizontal axis. • Range = the set of a function’s outputs, found on the vertical axis.
Example Graph the function. Then estimate the domain and range. Domain = [1, ) Range = [0, )
1.3Linear Functions, Slope, and Applications Determine the slope of a line given two points on the line. Solve applied problems involving slope and linear functions.
Linear Functions A function f is a linear function if it can be written as f(x) = mx + b, where m and b are constants. If m = 0, the function is a constant functionf(x) = b. If m = 1 and b = 0, the function is the identity function f(x) = x.
Linear Functions Nonlinear Functions y = 3 y = x y = x2 + 1 Examples
Horizontal lines are given by equations of the type y = b or f(x) = b. They are functions. Vertical lines are given by equations of the type x = a. They are not functions. x = 2 y = 2 Horizontal and Vertical Lines
Slope • The slopem of a line containing the points (x1, y1) and (x2, y2) is given by
Rise 2 Run 4 Example • Graph the function and determine its slope. Calculate two ordered pairs, plot the points, graph the function, and determine its slope.
A horizontal line has a slope of 0. Graph y = 4 and determine its slope. Choose any number for x; y must be 4. xy 4 4 2 4 1 4 A vertical line has an undefined slope because we cannot divide by zero. Graph x = 2 and determine its slope. Choose any number for y; x must be 2. xy 2 4 2 1 2 2 Horizontal and Vertical Lines
Positive—line slants up from left to right Negative—line slants down from left to right Zero—horizontal line Undefined—vertical line positive zero negative undefined Types of Slopes
1.4Equations of Lines and Modeling Find the slope and the y–intercept of a line given the equation y = mx + b, or f(x) = mx + b. Graph a linear equation using the slope and the y-intercept. Determine equations of lines. Given the equations of two lines, determine whether their graphs are parallel or whether they are perpendicular. Model a set of data with a linear function. Fit a regression line to a set of data; then use the linear model to make predictions.
The linear function f given by f(x) = mx + b has a graph that is a straight line parallel to y = mx. The constant m is called the slope, and the y-intercept is (0, b). f(x) = mx + b (0, b) y = mx (0, 0) Slope-Intercept Equation
Example Find the slope and y-intercept of the line with equation y = 0.36x + 4.2. Solution:y = 0.36x + 4.2 Slope = 0.36; y-intercept = (0, 4.2)
Example • Find the slope and y-intercept of the line with equation 4x + 3y 12 = 0. Solution: We solve for y: Thus, the slope is and the y-intercept is (0, 4).
Example • A line has slope 3 and contains the point (2, 5). Find an equation of the line. Solution: We use the slope-intercept equation, y = mx + b, and substitute for m. y = 3x + b. Using the point (2, 5), we substitute for x and y and solve for b. 5 = 3(2) + b 5 = 6 + b 11 = b The equation of the line is y = 3x + 11.
Example • Graph Solution: The equation is in slope-intercept form, y = mx + b. The y-intercept is (0, 2).
Point-Slope Equation The point-slope equation of the line with slope m passing through (x1, y1) is y y1 = m(x x1). Example: Find the equation of the line containing the points (2, 7) and (1, 8). Solution: First determine the slope: Using the point-slope equation, substitute 5 for m and either of the points for (x1, y1):
y = 3x + 2 y = 3x 4 Parallel Lines • Vertical lines are parallel. Nonvertical lines are parallel if and only if they have the same slope and different y-intercepts.
y = 3x 4 Perpendicular Lines • Two lines with slopes m1 and m2 are perpendicular if and only if the product of their slopes is 1: m1m2 = 1. • Lines are also perpendicular if one is vertical (x = a) and the other is horizontal (y = b).
Examples • Determine whether each of the following pairs of lines is parallel, perpendicular, or neither. a) y 4x = 3, 4y 8 = x (perpendicular) b) 2x + 3y = 4, 3x + 2y = 8 (neither) c) 2y = 4x + 12, y 8 = 2x (parallel)
Example • Write equations of the lines (a) parallel and (b) perpendicular to the graph of the line 3y + 4 = 18x and containing the point (1, 2). Solve the equation for y: (a) The line parallel to the given line will have the same slope. We use either the slope-intercept or point- slope equation for the line.
Example continued Substitute and solve the equation.
Example continued (b) For a line perpendicular: m =
Curve Fitting • In general, we try to find a function that fits, as well as possible, observations (data), theoretical reasoning, and common sense. • Example: Model the data given in the table on foreign travel on the next slide with two different linear functions. Then with each function, predict the number of U.S. travelers to foreign countries in 2005. Of the two models, which appears to be the better fit?
Model I: Choose any two points to determine the equation. Predict the number of travelers: Curve Fitting continued