Download
1 / 9
90 likes | 109 Vues
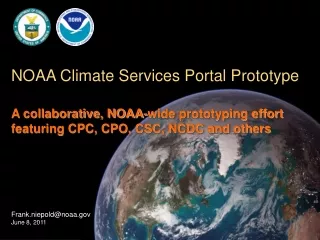
Collaborative NOAA-wide effort to enhance clarity, understandability, & usability for decision-makers, scientists, educators, and the public. Access climate data, resources, reports, and more.

E N D
NOAA Climate Services Portal Prototype A collaborative, NOAA-wide prototyping effort featuring CPC, CPO, CSC, NCDC and others Frank.niepold@noaa.gov June 8, 2011
Our four initial target audience groupings Decision Makers Science Policy Leaders NOAA Internal Scientists & Data Users Public Media Educators & Students Museums, Science Centers, and After School & Community-based Programs Science Attentive Public, Citizen Scientists Public Continuum Science Interested Publics Residual Public
Cross-walking our Climate.gov IA design drivers VALUE-ADDED CONTENT PRODUCED & CONTEXTUALIZED TO ENHANCE CLARITY, UNDERSTANDABILITY, & USABILITY FOR TARGET PUBLICS Climate Conditions News & Features Finding & Using Data Tools & Resources Teaching Climate Search Topics Society & Environment Regions NOAA CROSS-LINKED, CROSSWALKED & CLEARINGHOUSED CONTENT
Cross-walking our Climate.gov IA design drivers VALUE-ADDED CONTENT PRODUCED & CONTEXTUALIZED TO ENHANCE CLARITY, UNDERSTANDABILITY, & USABILITY FOR TARGET PUBLICS Climate Conditions News & Features Finding & Using Data Tools & Resources Teaching Climate Search Topics Society & Environment Regions NOAA Reports & Assessments Decision Support Tools Glossaries Bibliographies Presentations Fact Sheets Opportunities Calendar FAQ Water & Drought Temperature Precipitation Severe Weather Wildfires Natural Patterns Snow & Ice Ocean Ecosystems Teaching Activities Resources Teaching Opportunities Climate Careers Education Policy Climate Maps & Apps Climate Dashboard Climate Conditions Federated Search News How the Climate System Works Measurements & Models Global Warming & Climate Change Natural Variability Climate Impacts Planning & Policy CROSS-LINKED, CROSSWALKED & CLEARINGHOUSED CONTENT
Cross-walking our Climate.gov IA design drivers VALUE-ADDED CONTENT PRODUCED & CONTEXTUALIZED TO ENHANCE CLARITY, UNDERSTANDABILITY, & USABILITY FOR TARGET PUBLICS Finding & Using Data Tools & Resources Climate Conditions News & Features Teaching Climate Search Society & Environment Topics Regions NOAA All Articles All Datasets & Products All Images All Maps All Pictures All Videos Coastal Planning Extreme Events Marine Ecosystems Water Agriculture Civil Infrastructure Economy Energy Fisheries Human Health Insurance Litigation National Security Tourism Transportation Climate Policy » Adaptation » Mitigation Carbon Dioxide All Other GHGs The Sun Temperature Snow & Ice Climate Patterns Climate Change Air Quality Hurricanes & Storms Ocean & Climate CROSS-LINKED, CROSSWALKED & CLEARINGHOUSED CONTENT U.S. States U.S. Regions Nations Continents Ocean Basins Global Climate Data Centers Climate Service Centers Funding Opportunities Science Laboratories
NCS Portal Dashboardhttp://www.climate.gov • Just as a dashboard gives instant information on the status of a vehicle’s various systems, NOAA’s Global Climate Dashboard presents an overview of the current state of Earth’s climate system in historical context. • The Dashboard is designed for people seeking a synoptic view about what we know about climate variability and change, particularly policy leaders. • Adjustable sliders up top allow users to focus on the time period of interest. • Hover cursor over graphs to produce brief “tool-tip” snippets stating what each parameter is showing. • Click on graphs to jump to more detailed landing pages with more details produced in a popular style. • Future plans include: • Adding future climate scenarios out to 2100. • Making graphs more interactive, using MultiGraph • Rewriting Dashboard as an appliance that can be syndicated / hosted by others.
Climate Portal: http://www.climate.gov Global Climate Dashboard: http://www.climate.gov Climate Prediction CenterGIS Portal: http://www.cpc.ncep.noaa.gov/products/GIS/map_viewer/cpcgis.swf Monthly Climatic Datafor the World: http://gis.ncdc.noaa.gov/map/monthly/#
Multigraph Climate Explorer http://climateexplorer.multigraph.org
Multigraph Climate Explorer: http://climateexplorer.multigraph.org National Snow and Ice Data Center: http://nsidc.org/noaa/ Coral Reef Watch: http://coralreefwatch.noaa.gov/ Digital Coast - NOAA Coastal Services Center: http://www.csc.noaa.gov/digitalcoast/ NOAA Environmental Visualization Laboratory: http://www.nnvl.noaa.gov/