Spatial Analysis for Geographic Decision-Making
750 likes | 1.02k Vues
Explore the process of evaluating suitability, estimating, and interpreting results in spatial analysis. Learn how spatial analysis helps solve geographic problems like identifying high crime areas and choosing new business locations.

Spatial Analysis for Geographic Decision-Making
E N D
Presentation Transcript
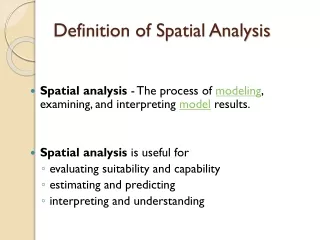
Definition of Spatial Analysis • Spatial analysis - The process of modeling, examining, and interpreting model results. • Spatial analysis is useful for • evaluating suitability and capability • estimating and predicting • interpreting and understanding
Spatial Analysis - cont. • There are four traditional types of spatial analysis: • Topological overlay and contiguityanalysis • Surfaceanalysis • Linear analysis • Rasteranalysis • Retrieval/classification/measurement • Overlay (arithmetic, various conversions) • Neighborhood • Connectivity
Definition of Spatial Analysis • Spatial data analysis involves the application of operations to coordinate and relate attribute data. • Spatial analyses are applied to solve problems related to geographic decisions • Identify high crime area • Selection of a best location for a new business • Extent of sage brush infestation in Idaho. • Spread of a disease • Etc…
Definition of Spatial Analysis - cont. • Spatial operations could be applied sequentially • An output could serve as input • Sequence of spatial operations is important Bolstad, 2005
Definition of Spatial Analysis - cont. • one input can have many outputs • many inputs can have one output Bolstad, 2005
Spatial Operations • Local operations • Neighborhood operations • Global operations Bolstad, 2005
GIS Analysis Functions Four broad categories
1. Retrieval, Classification, & Measurement Functions • Retrieval • Selective Search • Classification/Reclassification (Overlays, combine) • Identifying a set of features as belonging to a group • Defines patterns • Measurement • Distances, lengths, perimeters, areas
Selection • Selection operations • Involve identifying features based on several conditions or criteria • The attributes or geometry of features are checked against the conditions or criteria • You can write the selected features into new output data layer • You can use the selection for other analysis • Examples
Select: • State = Arkansas • States = entirely north of Arkansas • States_area>84,000 sq. mi. • States both entirely north of Arkansas and larger than 84,000 sq. mi. Bolstad, 2005
Functions of Spatial Analysis • Conditional selection • Set Algebra • Less than (<) • Greater than (>) • Equal to (=) • Not equal to (<>) • Boolean Algebra • Conditions OR, AND, and NOT Bolstad, 2005
Examples of Expression in Boolean Algebra Bolstad, 2005
Select by Location - cont. • Selecting options • That Meet • That Overlap • That Contains • That are Contained by • That are Entirely Contained By • That are Spatially Equal • That Touch
Examples of Selection by Location States adjacent to Missouri Bolstad, 2005
Examples of Selection by Location - cont. States containing a portion of Mississippi River or its tributaries are selected Bolstad, 2005
Classification • Categorization of geographic objects based on a set of conditions • Also known as reclassification or recoding • Spatial data operation can be used along with selection operation • Example: classify polygons based on size Bolstad, 2005
Classification - cont. • Classification is an operation to create a new group of classes from an existing set of classes • Classification is governed by a a table or array (decided by user before hand) Bolstad, 2005
Classification - example • Classification of land use for obtaining your required information
Classification - cont. • Binary classification • You need to have two classes • 0 and 1 • True or false • A and B • Some other two level classifications Bolstad, 2005
Automatic Classification • Automatic classification • Good for many classes in one feature file (when it is practically not possible to manually classify into groups) • Requires classification schemes (algorithms or mathematical formula) which will combine various classes into a single group • Equal interval • Defined interval • Natural breaks (Jenks) • Standard deviation
Classification Examples Quantile classification Bolstad, 2005
Retrieval: Selective Search addresses selected because they fall within circle
Reclassification (Vector) Dissolving to aggregate polygons
Reclassify by Area Size Work with areas > 80 acres
Reclassify by Contiguity Work with individual forest stands, rather than the class forest as a whole.
Reclassify values Work with elevations between 20 and 40 feet Change feet to meters
Buffer • one of the most common spatial analysis tools • specific distance representation around a feature • The distances can either be constant or can vary depending upon attribute values. • When features are close together, their buffers may overlap. The user can choose to preserve the overlaps or remove them. • The buffer operation creates a new polygon data set
Examples of Buffer Bolstad, 2005
Vector Distance Operation: Buffers & Setbacks Diagram of simple buffers and a setback. NOTE: buffers go outward from lines or areas; setbacks run inside of areas (not lines). Image Source: Chrisman, Nicholas.(2002). 2nd Ed. Exploring Geographic Information Systems. p 154. fig. 6-1.
Buffer Creation: Illustrated Image Source: Chrisman, Nicholas.(2002). 2nd Ed. Exploring Geographic Information Systems. p 60. fig. 6-3.
2. Overlay Functions • Arithmetic • addition, subtraction, division, multiplication • Logical • find where specified conditions occur (and, or, >, <, etc.) • Raster & Vector methods differ • Vector good for sparse data sets • Raster grid calculations easier • Overlay(demo – addition)
Overlay • Another common spatial analysis tool • Allows the user to identify areas where features in two layers overlap. • A new data set is often created from these overlaps. • In a Union Overlay, all features are included in the new data set but the features that overlap represent a new feature. • In an Intersect Overlay, only the areas that overlap are contained in the new data set.
Overlay Example • Analysis Tools • select Overlay • Intersect tool • Analysis Tools • select Overlay • Union tool
Examples Bolstad, 2005
Overlay Example - cont. • Vector overlay Bolstad, 2005
Overlay: Combining Attributes Select attributes of interest for a given location (Raster & vector methods do this differently, but the results are similar)
Vector based Overlay • 3 main types of vector overlay • point-in-polygon • line-in-polygon • polygon-on-polygon
Vector based overlay point-in-polygon example
Vector based overlay line-in-polygon example
Vector based overlay polygon-in-polygon example
Raster Based Overlay:Simple Addition Image Source: Chrisman, Nicholas.(2002). 2nd Ed. Exploring Geographic Information Systems. p 144. fig. 5-12.
Raster Overlay: Boolean Combine Image Source: Chrisman, Nicholas.(2002). 2nd Ed. Exploring Geographic Information Systems. p 125. fig. 5-3.
Overlay Example - cont. Raster overlay
Vector Overlay: Composite Structure Image Source: Chrisman, Nicholas.(2002). 2nd Ed. Exploring Geographic Information Systems. p 127. fig. 5-5.
3. Neighborhood Functions • Basic Functions • Average, diversity, majority, minimum/maximum, and total • Parameters to define: • Target location(s) • Specification of neighborhood • Function to perform on neighborhood elements
3. Neighborhood Function (cont) • Search Operation • most common neighborhood operation • Example • count the number of customers within 2 miles of the grocery store
3. Neighborhood Functions (cont) • Point or Line in Polygon Operation • Vector Model • specialized search function • Raster Model • polygons one data layer • points or lines in separate data layer • Buffers(demo - point, line, polygon)